
|
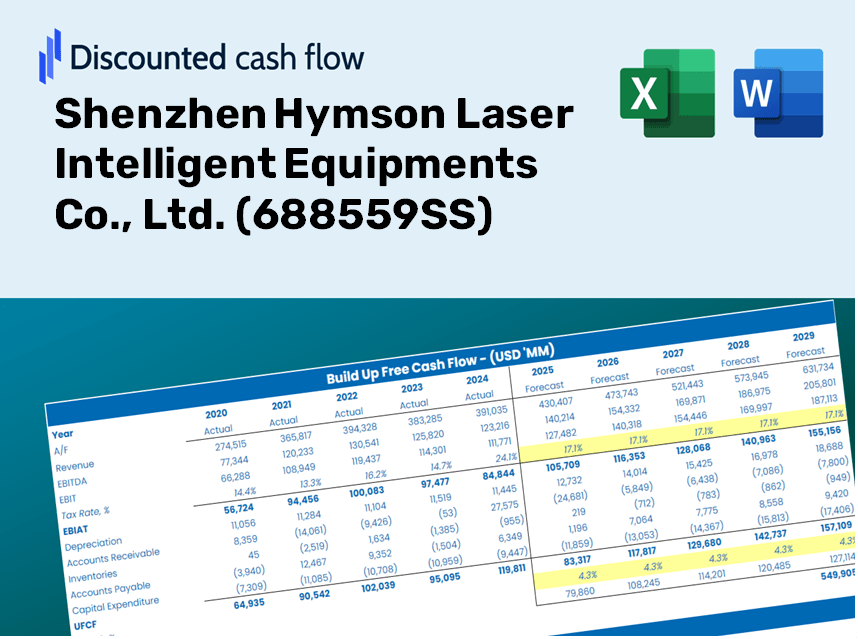
Shenzhen Hymson Laser Intelligent Equipments Co., Ltd. (688559.SS) DCF Valuation |
Fully Editable: Tailor To Your Needs In Excel Or Sheets
Professional Design: Trusted, Industry-Standard Templates
Investor-Approved Valuation Models
MAC/PC Compatible, Fully Unlocked
No Expertise Is Needed; Easy To Follow
Shenzhen Hymson Laser Intelligent Equipments Co., Ltd. (688559.SS) Bundle
Looking to determine the intrinsic value of Shenzhen Hymson Laser Intelligent Equipments Co., Ltd.? Our (688559SS) DCF Calculator integrates real-world data with comprehensive customization features, enabling you to adjust forecasts and enhance your investment strategies.
Benefits of Choosing Us
- Comprehensive Financial Model: Leverage Shenzhen Hymson Laser's actual data for an accurate DCF valuation.
- Complete Forecast Flexibility: Modify revenue growth rates, profit margins, WACC, and other essential parameters.
- Real-Time Calculations: Instant updates allow you to view results immediately as you make adjustments.
- Professional-Grade Template: A polished Excel file crafted for serious valuation needs.
- Customizable and Versatile: Designed for adaptability, enabling repeated use for in-depth forecasts.
Key Features
- 🔍 Real-Life Hymson Financials: Pre-filled historical and projected data for Shenzhen Hymson Laser Intelligent Equipments Co., Ltd. (688559SS).
- ✏️ Fully Customizable Inputs: Adjust all critical parameters (yellow cells) such as WACC, growth %, and tax rates.
- 📊 Professional DCF Valuation: Built-in formulas calculate Hymson’s intrinsic value using the Discounted Cash Flow method.
- ⚡ Instant Results: View Hymson’s valuation immediately upon making adjustments.
- Scenario Analysis: Evaluate and contrast outcomes based on various financial assumptions side-by-side.
How It Functions
- 1. Access the Template: Download and open the Excel template containing Shenzhen Hymson Laser Intelligent Equipments Co., Ltd.'s (688559SS) preloaded data.
- 2. Adjust Assumptions: Modify key inputs, including growth rates, WACC, and capital expenditures.
- 3. View Results in Real-Time: The DCF model automatically calculates intrinsic value and NPV based on your inputs.
- 4. Explore Scenarios: Assess various forecasts to evaluate different valuation scenarios.
- 5. Present with Assurance: Share professional valuation insights to substantiate your strategic decisions.
Why Select This Calculator for Shenzhen Hymson Laser Intelligent Equipments Co., Ltd. (688559SS)?
- Precise Data: Utilize actual financial figures from Hymson for trustworthy valuation outcomes.
- Flexible Options: Modify essential inputs such as growth rates, WACC, and tax rates to align with your forecasts.
- Efficient: Ready-made calculations save you the hassle of starting from the ground up.
- Expert-Level Tool: Tailored for investors, analysts, and consultants in the field.
- Easy to Use: An intuitive interface and clear step-by-step guidance cater to users of all skill levels.
Who Should Utilize This Product?
- Industry Professionals: Develop precise and trustworthy valuation frameworks for investment analysis in Shenzhen Hymson Laser Intelligent Equipments Co., Ltd. (688559SS).
- Finance Departments: Evaluate valuation scenarios to inform corporate strategy and decision-making.
- Financial Consultants: Offer clients detailed valuation evaluations and insights into Shenzhen Hymson Laser Intelligent Equipments Co., Ltd. (688559SS).
- Students and Educators: Engage with real data to improve financial modeling skills and education.
- Technology Investors: Gain insights into the valuation of innovative tech firms like Shenzhen Hymson Laser Intelligent Equipments Co., Ltd. (688559SS).
Contents of the Template
- Historical Data: Comprehensive financial records and forecasts for Shenzhen Hymson Laser Intelligent Equipments Co., Ltd. (688559SS).
- DCF and Levered DCF Models: Specialized templates designed for calculating the intrinsic value of Shenzhen Hymson Laser Intelligent Equipments Co., Ltd. (688559SS).
- WACC Sheet: Pre-configured calculations for the Weighted Average Cost of Capital.
- Editable Inputs: Customize essential drivers such as growth rates, EBITDA percentages, and CAPEX assumptions.
- Quarterly and Annual Statements: An in-depth analysis of Shenzhen Hymson Laser Intelligent Equipments Co., Ltd. (688559SS) financials.
- Interactive Dashboard: A dynamic interface for visualizing valuation outcomes and forecasts.
Disclaimer
All information, articles, and product details provided on this website are for general informational and educational purposes only. We do not claim any ownership over, nor do we intend to infringe upon, any trademarks, copyrights, logos, brand names, or other intellectual property mentioned or depicted on this site. Such intellectual property remains the property of its respective owners, and any references here are made solely for identification or informational purposes, without implying any affiliation, endorsement, or partnership.
We make no representations or warranties, express or implied, regarding the accuracy, completeness, or suitability of any content or products presented. Nothing on this website should be construed as legal, tax, investment, financial, medical, or other professional advice. In addition, no part of this site—including articles or product references—constitutes a solicitation, recommendation, endorsement, advertisement, or offer to buy or sell any securities, franchises, or other financial instruments, particularly in jurisdictions where such activity would be unlawful.
All content is of a general nature and may not address the specific circumstances of any individual or entity. It is not a substitute for professional advice or services. Any actions you take based on the information provided here are strictly at your own risk. You accept full responsibility for any decisions or outcomes arising from your use of this website and agree to release us from any liability in connection with your use of, or reliance upon, the content or products found herein.