
|
Bestechnic Co., Ltd. (688608.SS) DCF Valuation |
Fully Editable: Tailor To Your Needs In Excel Or Sheets
Professional Design: Trusted, Industry-Standard Templates
Investor-Approved Valuation Models
MAC/PC Compatible, Fully Unlocked
No Expertise Is Needed; Easy To Follow
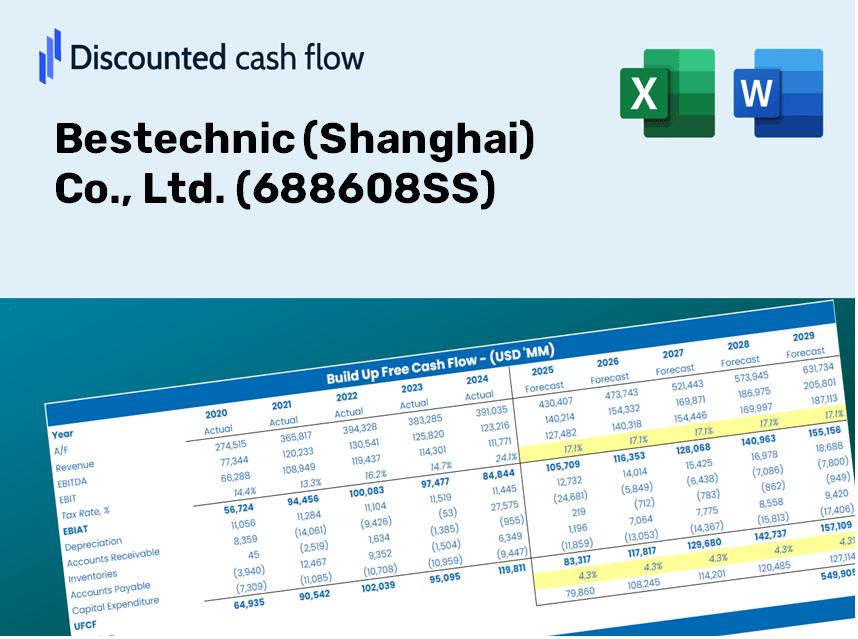
Bestechnic (Shanghai) Co., Ltd. (688608.SS) Bundle
Enhance your investment strategy with the Bestechnic (Shanghai) Co., Ltd. (688608SS) DCF Calculator! Explore authentic financial data, adjust growth projections and expenses, and instantly observe how these modifications affect the intrinsic value of Bestechnic (Shanghai) Co., Ltd. (688608SS).
Discounted Cash Flow (DCF) - (USD MM)
| Year | AY1 2020 |
AY2 2021 |
AY3 2022 |
AY4 2023 |
AY5 2024 |
FY1 2025 |
FY2 2026 |
FY3 2027 |
FY4 2028 |
FY5 2029 |
|---|---|---|---|---|---|---|---|---|---|---|
| Revenue | 1,061.2 | 1,765.3 | 1,484.8 | 2,176.3 | 3,263.1 | 4,462.2 | 6,101.8 | 8,343.8 | 11,409.7 | 15,602.2 |
| Revenue Growth, % | 0 | 66.36 | -15.89 | 46.57 | 49.94 | 36.74 | 36.74 | 36.74 | 36.74 | 36.74 |
| EBITDA | 199.4 | 303.1 | 14.9 | 77.7 | 353.0 | 458.2 | 626.6 | 856.8 | 1,171.7 | 1,602.2 |
| EBITDA, % | 18.79 | 17.17 | 1 | 3.57 | 10.82 | 10.27 | 10.27 | 10.27 | 10.27 | 10.27 |
| Depreciation | 17.7 | 29.8 | 52.4 | 82.5 | 33.1 | 104.4 | 142.8 | 195.2 | 266.9 | 365.0 |
| Depreciation, % | 1.67 | 1.69 | 3.53 | 3.79 | 1.02 | 2.34 | 2.34 | 2.34 | 2.34 | 2.34 |
| EBIT | 181.6 | 273.3 | -37.6 | -4.8 | 319.9 | 353.8 | 483.8 | 661.6 | 904.7 | 1,237.2 |
| EBIT, % | 17.12 | 15.48 | -2.53 | -0.21984 | 9.8 | 7.93 | 7.93 | 7.93 | 7.93 | 7.93 |
| Total Cash | 5,452.7 | 5,296.8 | 4,700.7 | 4,861.5 | 5,170.8 | 4,462.2 | 6,101.8 | 8,343.8 | 11,409.7 | 15,602.2 |
| Total Cash, percent | .0 | .0 | .0 | .0 | .0 | .0 | .0 | .0 | .0 | .0 |
| Account Receivables | 81.6 | 330.2 | 288.9 | 412.1 | 385.7 | 683.7 | 934.9 | 1,278.4 | 1,748.2 | 2,390.6 |
| Account Receivables, % | 7.69 | 18.71 | 19.46 | 18.94 | 11.82 | 15.32 | 15.32 | 15.32 | 15.32 | 15.32 |
| Inventories | 168.3 | 541.0 | 946.0 | 657.8 | 724.2 | 1,451.4 | 1,984.8 | 2,714.0 | 3,711.3 | 5,075.0 |
| Inventories, % | 15.86 | 30.64 | 63.71 | 30.22 | 22.19 | 32.53 | 32.53 | 32.53 | 32.53 | 32.53 |
| Accounts Payable | 170.8 | 340.7 | 184.6 | 287.2 | 297.5 | 626.0 | 856.0 | 1,170.5 | 1,600.6 | 2,188.7 |
| Accounts Payable, % | 16.1 | 19.3 | 12.44 | 13.2 | 9.12 | 14.03 | 14.03 | 14.03 | 14.03 | 14.03 |
| Capital Expenditure | -25.7 | -138.6 | -147.4 | -193.7 | -171.4 | -306.6 | -419.2 | -573.3 | -783.9 | -1,072.0 |
| Capital Expenditure, % | -2.42 | -7.85 | -9.93 | -8.9 | -5.25 | -6.87 | -6.87 | -6.87 | -6.87 | -6.87 |
| Tax Rate, % | 0.31595 | 0.31595 | 0.31595 | 0.31595 | 0.31595 | 0.31595 | 0.31595 | 0.31595 | 0.31595 | 0.31595 |
| EBITAT | 180.3 | 271.8 | -37.1 | -4.8 | 318.9 | 351.3 | 480.4 | 656.9 | 898.3 | 1,228.4 |
| Depreciation | ||||||||||
| Changes in Account Receivables | ||||||||||
| Changes in Inventories | ||||||||||
| Changes in Accounts Payable | ||||||||||
| Capital Expenditure | ||||||||||
| UFCF | 93.2 | -288.4 | -651.7 | 151.6 | 150.9 | -547.5 | -350.6 | -479.4 | -655.6 | -896.5 |
| WACC, % | 9.73 | 9.73 | 9.73 | 9.73 | 9.73 | 9.73 | 9.73 | 9.73 | 9.73 | 9.73 |
| PV UFCF | ||||||||||
| SUM PV UFCF | -2,168.5 | |||||||||
| Long Term Growth Rate, % | 2.00 | |||||||||
| Free cash flow (T + 1) | -914 | |||||||||
| Terminal Value | -11,824 | |||||||||
| Present Terminal Value | -7,432 | |||||||||
| Enterprise Value | -9,600 | |||||||||
| Net Debt | -3,781 | |||||||||
| Equity Value | -5,819 | |||||||||
| Diluted Shares Outstanding, MM | 169 | |||||||||
| Equity Value Per Share | -34.46 |
What You Will Receive
- Customizable Excel Template: A fully adaptable Excel-based DCF Calculator featuring pre-loaded financial data for Bestechnic (Shanghai) Co., Ltd. (688608SS).
- Accurate Market Data: Historical performance metrics and projected estimates (highlighted in the yellow cells).
- Adjustable Forecasts: Modify key assumptions such as revenue growth, EBITDA margin, and WACC.
- Real-Time Calculations: Instantly observe how your input affects the valuation of Bestechnic (Shanghai) Co., Ltd. (688608SS).
- Professional-Grade Tool: Designed for investors, CFOs, consultants, and financial analysts.
- Intuitive User Experience: Organized for simplicity and usability, complete with step-by-step guidance.
Essential Features
- Customizable Forecast Inputs: Adjust vital factors such as revenue growth, EBITDA percentage, and capital expenditures.
- Instant DCF Valuation: Quickly calculates intrinsic value, NPV, and other financial metrics.
- High-Precision Accuracy: Leverages Bestechnic (Shanghai) Co., Ltd.'s real-world financial data for credible valuation results.
- Effortless Scenario Analysis: Easily evaluate various assumptions and analyze their impact on results.
- Efficiency Booster: Say goodbye to building intricate valuation models from the ground up.
How It Functions
- 1. Access the Template: Download and open the Excel file containing Bestechnic's preloaded data.
- 2. Modify Assumptions: Adjust essential inputs such as growth projections, WACC, and capital expenditures.
- 3. Instant Results: The DCF model automatically computes intrinsic value and NPV in real-time.
- 4. Evaluate Scenarios: Analyze various forecasts to explore different valuation possibilities.
- 5. Present with Assurance: Share professional valuation insights to back up your decision-making.
Why Choose This Calculator for Bestechnic (Shanghai) Co., Ltd. (688608SS)?
- Reliable Data: Access up-to-date financials for Bestechnic, ensuring trustworthy valuation outcomes.
- Tailorable Options: Modify essential parameters such as growth rates, WACC, and tax rates to align with your forecasts.
- Efficiency Boost: Ready-to-use calculations save you time and effort, eliminating the need for a fresh start.
- Industry-Standard Tool: Crafted for investors, analysts, and consultants in the field.
- Easy to Use: The intuitive design and detailed instructions make it accessible for all users.
Who Should Use This Product?
- Individual Investors: Gain insights to make well-informed decisions on buying or selling Bestechnic (688608SS) shares.
- Financial Analysts: Enhance valuation efficiency using comprehensive financial models tailored for Bestechnic (688608SS).
- Consultants: Provide clients with accurate and timely valuation analyses related to Bestechnic (688608SS).
- Business Owners: Learn from the valuation strategies of companies like Bestechnic (688608SS) to inform your own business direction.
- Finance Students: Explore real-world valuation methodologies utilizing data from Bestechnic (688608SS).
Contents of the Template
- Historical Data: Comprises Bestechnic’s previous financial records and foundational forecasts.
- DCF and Levered DCF Models: Comprehensive templates for assessing Bestechnic's intrinsic value.
- WACC Sheet: Pre-calculated figures for Weighted Average Cost of Capital.
- Editable Inputs: Adjust essential drivers such as growth rates, EBITDA %, and CAPEX projections.
- Quarterly and Annual Statements: An in-depth analysis of Bestechnic’s financial performance.
- Interactive Dashboard: Dynamically visualize valuation outcomes and forecasts.
Disclaimer
All information, articles, and product details provided on this website are for general informational and educational purposes only. We do not claim any ownership over, nor do we intend to infringe upon, any trademarks, copyrights, logos, brand names, or other intellectual property mentioned or depicted on this site. Such intellectual property remains the property of its respective owners, and any references here are made solely for identification or informational purposes, without implying any affiliation, endorsement, or partnership.
We make no representations or warranties, express or implied, regarding the accuracy, completeness, or suitability of any content or products presented. Nothing on this website should be construed as legal, tax, investment, financial, medical, or other professional advice. In addition, no part of this site—including articles or product references—constitutes a solicitation, recommendation, endorsement, advertisement, or offer to buy or sell any securities, franchises, or other financial instruments, particularly in jurisdictions where such activity would be unlawful.
All content is of a general nature and may not address the specific circumstances of any individual or entity. It is not a substitute for professional advice or services. Any actions you take based on the information provided here are strictly at your own risk. You accept full responsibility for any decisions or outcomes arising from your use of this website and agree to release us from any liability in connection with your use of, or reliance upon, the content or products found herein.