
|
OPT Machine Vision Tech Co., Ltd. (688686.SS) DCF Valuation |
Fully Editable: Tailor To Your Needs In Excel Or Sheets
Professional Design: Trusted, Industry-Standard Templates
Investor-Approved Valuation Models
MAC/PC Compatible, Fully Unlocked
No Expertise Is Needed; Easy To Follow
OPT Machine Vision Tech Co., Ltd. (688686.SS) Bundle
Discover the true potential of OPT Machine Vision Tech Co., Ltd. (688686SS) with our advanced DCF Calculator! Adjust key assumptions, explore various scenarios, and evaluate how changes affect OPT Machine Vision Tech Co., Ltd. (688686SS) valuation – all within a convenient Excel template.
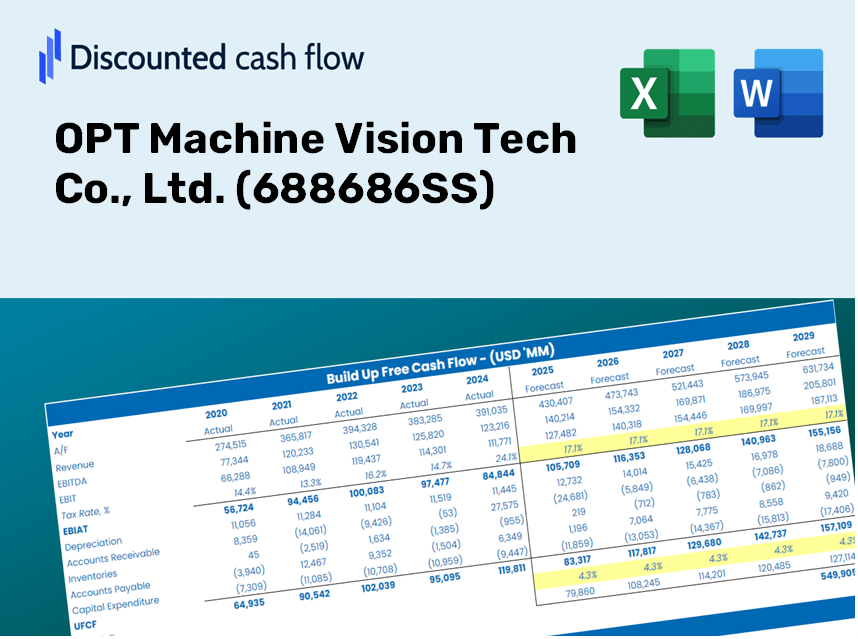
Discounted Cash Flow (DCF) - (USD MM)
| Year | AY1 2020 |
AY2 2021 |
AY3 2022 |
AY4 2023 |
AY5 2024 |
FY1 2025 |
FY2 2026 |
FY3 2027 |
FY4 2028 |
FY5 2029 |
|---|---|---|---|---|---|---|---|---|---|---|
| Revenue | 642.4 | 875.1 | 1,141.0 | 943.9 | 911.4 | 1,015.9 | 1,132.4 | 1,262.3 | 1,407.1 | 1,568.5 |
| Revenue Growth, % | 0 | 36.21 | 30.39 | -17.27 | -3.44 | 11.47 | 11.47 | 11.47 | 11.47 | 11.47 |
| EBITDA | 270.9 | 274.6 | 320.4 | 167.7 | 96.9 | 264.2 | 294.5 | 328.3 | 366.0 | 407.9 |
| EBITDA, % | 42.17 | 31.39 | 28.08 | 17.77 | 10.63 | 26.01 | 26.01 | 26.01 | 26.01 | 26.01 |
| Depreciation | 4.7 | 5.4 | 5.9 | 14.8 | 17.0 | 10.8 | 12.0 | 13.4 | 14.9 | 16.6 |
| Depreciation, % | 0.73431 | 0.61707 | 0.52046 | 1.57 | 1.86 | 1.06 | 1.06 | 1.06 | 1.06 | 1.06 |
| EBIT | 266.2 | 269.3 | 314.5 | 152.9 | 79.9 | 253.5 | 282.5 | 314.9 | 351.1 | 391.3 |
| EBIT, % | 41.44 | 30.77 | 27.56 | 16.2 | 8.77 | 24.95 | 24.95 | 24.95 | 24.95 | 24.95 |
| Total Cash | 1,858.2 | 1,832.1 | 1,586.6 | 1,597.1 | 1,183.3 | 1,015.9 | 1,132.4 | 1,262.3 | 1,407.1 | 1,568.5 |
| Total Cash, percent | .0 | .0 | .0 | .0 | .0 | .0 | .0 | .0 | .0 | .0 |
| Account Receivables | 397.2 | 488.6 | 792.1 | 788.0 | 953.4 | 752.9 | 839.3 | 935.6 | 1,042.9 | 1,162.5 |
| Account Receivables, % | 61.82 | 55.84 | 69.43 | 83.48 | 104.61 | 74.11 | 74.11 | 74.11 | 74.11 | 74.11 |
| Inventories | 71.8 | 154.3 | 145.2 | 115.8 | 144.4 | 141.5 | 157.7 | 175.8 | 196.0 | 218.5 |
| Inventories, % | 11.17 | 17.64 | 12.73 | 12.27 | 15.84 | 13.93 | 13.93 | 13.93 | 13.93 | 13.93 |
| Accounts Payable | 43.4 | 88.2 | 67.1 | 112.3 | 160.6 | 106.2 | 118.3 | 131.9 | 147.0 | 163.9 |
| Accounts Payable, % | 6.76 | 10.08 | 5.88 | 11.89 | 17.63 | 10.45 | 10.45 | 10.45 | 10.45 | 10.45 |
| Capital Expenditure | -35.2 | -133.9 | -222.4 | -123.6 | -92.7 | -129.1 | -143.9 | -160.4 | -178.8 | -199.3 |
| Capital Expenditure, % | -5.48 | -15.3 | -19.49 | -13.1 | -10.17 | -12.71 | -12.71 | -12.71 | -12.71 | -12.71 |
| Tax Rate, % | -5.83 | -5.83 | -5.83 | -5.83 | -5.83 | -5.83 | -5.83 | -5.83 | -5.83 | -5.83 |
| EBITAT | 231.0 | 241.9 | 286.1 | 147.9 | 84.6 | 235.4 | 262.4 | 292.5 | 326.0 | 363.4 |
| Depreciation | ||||||||||
| Changes in Account Receivables | ||||||||||
| Changes in Inventories | ||||||||||
| Changes in Accounts Payable | ||||||||||
| Capital Expenditure | ||||||||||
| UFCF | -225.0 | -15.8 | -245.8 | 117.7 | -136.7 | 265.8 | 40.0 | 44.6 | 49.7 | 55.4 |
| WACC, % | 9.63 | 9.63 | 9.63 | 9.63 | 9.63 | 9.63 | 9.63 | 9.63 | 9.63 | 9.63 |
| PV UFCF | ||||||||||
| SUM PV UFCF | 379.1 | |||||||||
| Long Term Growth Rate, % | 4.00 | |||||||||
| Free cash flow (T + 1) | 58 | |||||||||
| Terminal Value | 1,024 | |||||||||
| Present Terminal Value | 647 | |||||||||
| Enterprise Value | 1,026 | |||||||||
| Net Debt | -236 | |||||||||
| Equity Value | 1,262 | |||||||||
| Diluted Shares Outstanding, MM | 122 | |||||||||
| Equity Value Per Share | 10.32 |
What You Will Get
- Genuine OPT Data: Preloaded financial metrics – including revenue and EBIT – derived from both historical and projected data.
- Comprehensive Customization: Modify essential parameters (highlighted cells) such as WACC, growth percentage, and tax rates to suit your analysis.
- Immediate Valuation Adjustments: Automatic recalculations to evaluate how changes affect the fair value of OPT Machine Vision Tech Co., Ltd. (688686SS).
- Flexible Excel Template: Designed for easy modifications, scenario analysis, and in-depth forecasting.
- Efficient and Precise: Eliminate the need to build models from the ground up while ensuring accuracy and adaptability.
Core Benefits
- Comprehensive Financial Data: Gain access to precise, pre-loaded historical figures and future forecasts tailored for OPT Machine Vision Tech Co., Ltd. (688686SS).
- Adjustable Forecast Parameters: Modify highlighted cells for key inputs like WACC, growth rates, and profit margins.
- Real-Time Calculations: DCF, Net Present Value (NPV), and cash flow analyses update automatically as changes are made.
- User-Friendly Dashboard: Intuitive charts and summaries that facilitate the visualization of your valuation outcomes.
- Designed for All Skill Levels: A straightforward, user-centered design catering to investors, CFOs, and consultants alike.
How It Functions
- 1. Access the Template: Download and open the Excel file containing OPT Machine Vision Tech Co., Ltd.'s preloaded data.
- 2. Adjust Assumptions: Modify key inputs such as growth rates, WACC, and capital expenditures to fit your analysis.
- 3. See Results Instantly: The DCF model automatically computes intrinsic value and NPV for you.
- 4. Explore Scenarios: Evaluate various forecasts to assess different valuation results.
- 5. Present with Assurance: Showcase professional valuation insights to back up your decisions regarding (688686SS).
Why Choose This Calculator for OPT Machine Vision Tech Co., Ltd. (688686SS)?
- Designed for Industry Experts: A sophisticated tool utilized by engineers, analysts, and technology consultants.
- Comprehensive Data: Historical and projected financials for OPT Machine Vision preloaded for reliability.
- Versatile Scenario Analysis: Effortlessly test various forecasts and assumptions.
- Transparent Results: Automatically computes intrinsic value, NPV, and essential metrics.
- User-Friendly Interface: Step-by-step guidance simplifies the calculation process.
Who Can Benefit from OPT Machine Vision Tech Co., Ltd. (688686SS)?
- Investors: Make informed investment choices with our advanced machine vision solutions.
- Industry Analysts: Streamline your analysis using our comprehensive technology reports and insights.
- Consultants: Efficiently tailor our tools for client demonstrations or strategic recommendations.
- Tech Enthusiasts: Enhance your knowledge of machine vision technologies through practical applications and case studies.
- Educators and Students: Utilize our resources as hands-on learning materials in technology and engineering courses.
What the Template Includes
- Historical Data: Contains OPT Machine Vision Tech Co., Ltd.'s past financials and foundational forecasts.
- DCF and Levered DCF Models: Comprehensive templates for calculating the intrinsic value of OPT Machine Vision Tech Co., Ltd. (688686SS).
- WACC Sheet: Pre-configured calculations for Weighted Average Cost of Capital.
- Editable Inputs: Customize critical drivers such as growth rates, EBITDA %, and CAPEX assumptions.
- Quarterly and Annual Statements: A thorough breakdown of OPT Machine Vision Tech Co., Ltd. (688686SS)'s financial performance.
- Interactive Dashboard: Dynamically visualize valuation outcomes and forecasts.
Disclaimer
All information, articles, and product details provided on this website are for general informational and educational purposes only. We do not claim any ownership over, nor do we intend to infringe upon, any trademarks, copyrights, logos, brand names, or other intellectual property mentioned or depicted on this site. Such intellectual property remains the property of its respective owners, and any references here are made solely for identification or informational purposes, without implying any affiliation, endorsement, or partnership.
We make no representations or warranties, express or implied, regarding the accuracy, completeness, or suitability of any content or products presented. Nothing on this website should be construed as legal, tax, investment, financial, medical, or other professional advice. In addition, no part of this site—including articles or product references—constitutes a solicitation, recommendation, endorsement, advertisement, or offer to buy or sell any securities, franchises, or other financial instruments, particularly in jurisdictions where such activity would be unlawful.
All content is of a general nature and may not address the specific circumstances of any individual or entity. It is not a substitute for professional advice or services. Any actions you take based on the information provided here are strictly at your own risk. You accept full responsibility for any decisions or outcomes arising from your use of this website and agree to release us from any liability in connection with your use of, or reliance upon, the content or products found herein.