
|
Suzhou Veichi Electric Co., Ltd. (688698.SS) DCF Valuation |
Fully Editable: Tailor To Your Needs In Excel Or Sheets
Professional Design: Trusted, Industry-Standard Templates
Investor-Approved Valuation Models
MAC/PC Compatible, Fully Unlocked
No Expertise Is Needed; Easy To Follow
Suzhou Veichi Electric Co., Ltd. (688698.SS) Bundle
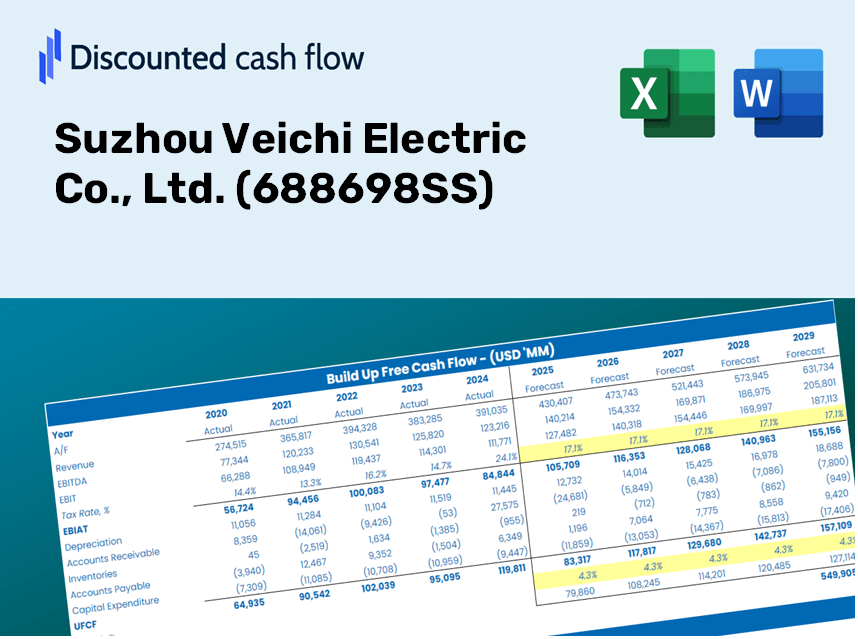
Simplify Suzhou Veichi Electric Co., Ltd. (688698SS) valuation with this customizable DCF Calculator! Featuring real Suzhou Veichi Electric Co., Ltd. (688698SS) financials and adjustable forecast inputs, you can test scenarios and uncover Suzhou Veichi Electric Co., Ltd. (688698SS) fair value in minutes.
Discounted Cash Flow (DCF) - (USD MM)
| Year | AY1 2020 |
AY2 2021 |
AY3 2022 |
AY4 2023 |
AY5 2024 |
FY1 2025 |
FY2 2026 |
FY3 2027 |
FY4 2028 |
FY5 2029 |
|---|---|---|---|---|---|---|---|---|---|---|
| Revenue | 572.2 | 818.9 | 906.0 | 1,304.9 | 1,640.2 | 2,146.4 | 2,808.9 | 3,676.0 | 4,810.6 | 6,295.4 |
| Revenue Growth, % | 0 | 43.1 | 10.64 | 44.03 | 25.7 | 30.87 | 30.87 | 30.87 | 30.87 | 30.87 |
| EBITDA | 106.5 | 129.4 | 126.3 | 197.7 | 244.2 | 336.6 | 440.4 | 576.4 | 754.3 | 987.1 |
| EBITDA, % | 18.61 | 15.8 | 13.94 | 15.15 | 14.89 | 15.68 | 15.68 | 15.68 | 15.68 | 15.68 |
| Depreciation | 10.6 | 13.6 | 16.3 | 21.8 | 29.5 | 37.7 | 49.4 | 64.6 | 84.5 | 110.6 |
| Depreciation, % | 1.85 | 1.67 | 1.8 | 1.67 | 1.8 | 1.76 | 1.76 | 1.76 | 1.76 | 1.76 |
| EBIT | 95.9 | 115.8 | 110.0 | 175.9 | 214.6 | 298.8 | 391.1 | 511.8 | 669.7 | 876.5 |
| EBIT, % | 16.76 | 14.14 | 12.15 | 13.48 | 13.09 | 13.92 | 13.92 | 13.92 | 13.92 | 13.92 |
| Total Cash | 518.9 | 268.2 | 355.7 | 170.1 | 167.0 | 798.1 | 1,044.4 | 1,366.8 | 1,788.7 | 2,340.8 |
| Total Cash, percent | .0 | .0 | .0 | .0 | .0 | .0 | .0 | .0 | .0 | .0 |
| Account Receivables | 288.1 | 427.7 | 435.9 | 689.5 | 899.4 | 1,109.1 | 1,451.4 | 1,899.4 | 2,485.7 | 3,252.9 |
| Account Receivables, % | 50.35 | 52.23 | 48.11 | 52.84 | 54.84 | 51.67 | 51.67 | 51.67 | 51.67 | 51.67 |
| Inventories | 147.2 | 210.2 | 230.7 | 219.4 | 302.9 | 481.4 | 630.0 | 824.4 | 1,078.9 | 1,411.9 |
| Inventories, % | 25.73 | 25.67 | 25.47 | 16.81 | 18.47 | 22.43 | 22.43 | 22.43 | 22.43 | 22.43 |
| Accounts Payable | 150.6 | 122.8 | 248.1 | 332.1 | 551.2 | 548.5 | 717.8 | 939.3 | 1,229.2 | 1,608.6 |
| Accounts Payable, % | 26.32 | 15 | 27.38 | 25.45 | 33.61 | 25.55 | 25.55 | 25.55 | 25.55 | 25.55 |
| Capital Expenditure | -12.7 | -41.4 | -90.6 | -182.5 | -200.3 | -186.6 | -244.2 | -319.6 | -418.3 | -547.4 |
| Capital Expenditure, % | -2.22 | -5.06 | -10 | -13.98 | -12.21 | -8.7 | -8.7 | -8.7 | -8.7 | -8.7 |
| Tax Rate, % | -0.509 | -0.509 | -0.509 | -0.509 | -0.509 | -0.509 | -0.509 | -0.509 | -0.509 | -0.509 |
| EBITAT | 86.3 | 107.2 | 104.6 | 168.6 | 215.7 | 283.0 | 370.3 | 484.6 | 634.2 | 829.9 |
| Depreciation | ||||||||||
| Changes in Account Receivables | ||||||||||
| Changes in Inventories | ||||||||||
| Changes in Accounts Payable | ||||||||||
| Capital Expenditure | ||||||||||
| UFCF | -200.5 | -150.9 | 126.7 | -150.3 | -29.4 | -256.9 | -146.2 | -191.3 | -250.4 | -327.7 |
| WACC, % | 7.34 | 7.34 | 7.34 | 7.34 | 7.34 | 7.34 | 7.34 | 7.34 | 7.34 | 7.34 |
| PV UFCF | ||||||||||
| SUM PV UFCF | -939.6 | |||||||||
| Long Term Growth Rate, % | 2.00 | |||||||||
| Free cash flow (T + 1) | -334 | |||||||||
| Terminal Value | -6,262 | |||||||||
| Present Terminal Value | -4,395 | |||||||||
| Enterprise Value | -5,335 | |||||||||
| Net Debt | -90 | |||||||||
| Equity Value | -5,245 | |||||||||
| Diluted Shares Outstanding, MM | 211 | |||||||||
| Equity Value Per Share | -24.91 |
What You Will Receive
- Customizable Excel Template: A fully editable Excel-based DCF Calculator featuring pre-loaded financial data for Suzhou Veichi Electric Co., Ltd. (688698SS).
- Authentic Data: Access to historical performance data and future projections (highlighted in the yellow cells).
- Adjustable Forecasts: Modify key assumptions such as revenue growth rates, EBITDA margins, and WACC.
- Instant Calculations: Quickly observe how your inputs affect the valuation of Suzhou Veichi Electric Co., Ltd. (688698SS).
- Professional Resource: Designed for use by investors, CFOs, consultants, and financial analysts.
- Intuitive Interface: Organized for simplicity and user-friendliness, complete with step-by-step guidance.
Core Capabilities
- Customizable Forecast Inputs: Adjust essential variables such as sales growth, EBITDA margin, and capital investments.
- Instant DCF Valuation: Automatically computes intrinsic value, NPV, and additional financial metrics in real-time.
- High-Precision Accuracy: Leverages Suzhou Veichi Electric's actual financial data for dependable valuation results.
- Simplified Scenario Analysis: Evaluate various assumptions and easily compare results.
- Efficiency-Boosting Tool: Avoid the hassle of creating intricate valuation models from the ground up.
How It Operates
- Obtain the Template: Gain immediate access to the Excel-based Suzhou Veichi Electric DCF Calculator for (688698SS).
- Enter Your Assumptions: Modify the yellow-highlighted cells to set growth rates, WACC, profit margins, and additional parameters.
- Real-Time Calculations: The model will promptly update the intrinsic value of Suzhou Veichi Electric.
- Explore Scenarios: Test various assumptions to assess how they might impact the valuation.
- Evaluate and Act: Leverage the findings to inform your investment or financial strategies.
Why Choose This Calculator for Suzhou Veichi Electric Co., Ltd. (688698SS)?
- Reliable Data: Access authentic financials from Suzhou Veichi for dependable valuation outcomes.
- Flexible Options: Modify essential factors such as growth rates, WACC, and tax rates to align with your forecasts.
- Efficient: Pre-configured calculations save you the hassle of starting from square one.
- Professional-Quality Tool: Crafted for use by investors, analysts, and consultants.
- User-Friendly Design: Clear layout and straightforward instructions make it accessible for everyone.
Who Should Utilize This Product?
- Investors: Effectively assess the fair value of Suzhou Veichi Electric Co., Ltd. (688698SS) prior to making investment choices.
- CFOs: Utilize a high-quality DCF model for enhanced financial reporting and analysis.
- Consultants: Easily modify the template for client valuation reports.
- Entrepreneurs: Acquire insights into the financial modeling techniques employed by leading companies.
- Educators: Implement it as an educational resource to illustrate valuation methods.
What the Template Includes
- In-Depth DCF Model: Editable template featuring comprehensive valuation analyses.
- Real-World Data: Suzhou Veichi Electric Co., Ltd.'s historical and projected financials (688698SS) preloaded for evaluation.
- Adjustable Parameters: Modify WACC, growth rates, and tax assumptions to explore different scenarios.
- Financial Statements: Complete annual and quarterly breakdowns for enhanced insights.
- Key Ratios: Integrated analysis of profitability, efficiency, and leverage metrics.
- Dashboard with Visual Outputs: Charts and tables for straightforward, actionable insights.
Disclaimer
All information, articles, and product details provided on this website are for general informational and educational purposes only. We do not claim any ownership over, nor do we intend to infringe upon, any trademarks, copyrights, logos, brand names, or other intellectual property mentioned or depicted on this site. Such intellectual property remains the property of its respective owners, and any references here are made solely for identification or informational purposes, without implying any affiliation, endorsement, or partnership.
We make no representations or warranties, express or implied, regarding the accuracy, completeness, or suitability of any content or products presented. Nothing on this website should be construed as legal, tax, investment, financial, medical, or other professional advice. In addition, no part of this site—including articles or product references—constitutes a solicitation, recommendation, endorsement, advertisement, or offer to buy or sell any securities, franchises, or other financial instruments, particularly in jurisdictions where such activity would be unlawful.
All content is of a general nature and may not address the specific circumstances of any individual or entity. It is not a substitute for professional advice or services. Any actions you take based on the information provided here are strictly at your own risk. You accept full responsibility for any decisions or outcomes arising from your use of this website and agree to release us from any liability in connection with your use of, or reliance upon, the content or products found herein.