
|
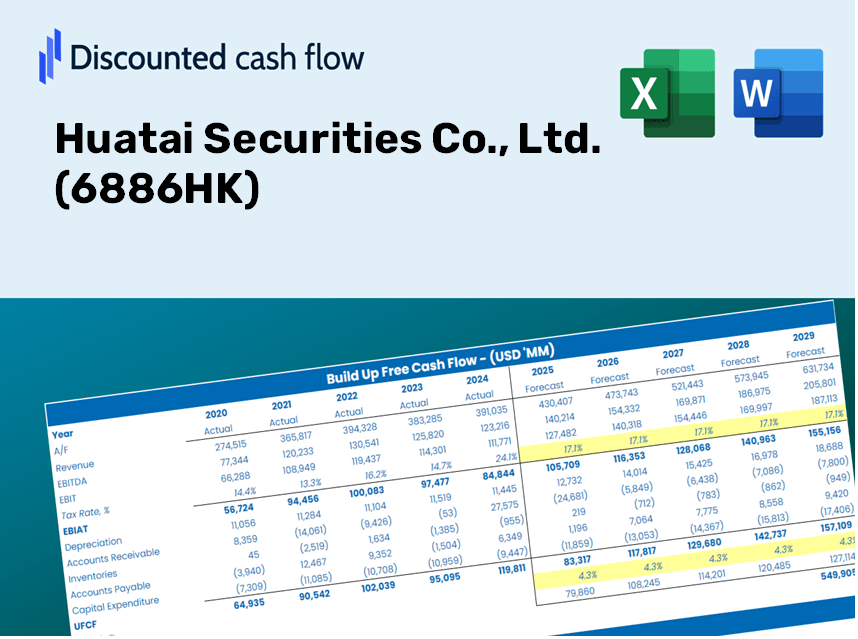
Huatai Securities Co., Ltd. (6886.HK) DCF Valuation |
Fully Editable: Tailor To Your Needs In Excel Or Sheets
Professional Design: Trusted, Industry-Standard Templates
Investor-Approved Valuation Models
MAC/PC Compatible, Fully Unlocked
No Expertise Is Needed; Easy To Follow
Huatai Securities Co., Ltd. (6886.HK) Bundle
Looking to assess the intrinsic value of Huatai Securities Co., Ltd.? Our (6886HK) DCF Calculator integrates real-world data with comprehensive customization features, allowing you to refine your forecasts and enhance your investment choices.
Discounted Cash Flow (DCF) - (USD MM)
| Year | AY1 2020 |
AY2 2021 |
AY3 2022 |
AY4 2023 |
AY5 2024 |
FY1 2025 |
FY2 2026 |
FY3 2027 |
FY4 2028 |
FY5 2029 |
|---|---|---|---|---|---|---|---|---|---|---|
| Revenue | 29,844.9 | 50,690.9 | 45,932.7 | 37,242.6 | 46,519.5 | 54,247.7 | 63,259.7 | 73,768.9 | 86,024.0 | 100,315.0 |
| Revenue Growth, % | 0 | 69.85 | -9.39 | -18.92 | 24.91 | 16.61 | 16.61 | 16.61 | 16.61 | 16.61 |
| EBITDA | .0 | .0 | .0 | .0 | 18,615.3 | 4,341.6 | 5,062.8 | 5,903.9 | 6,884.7 | 8,028.4 |
| EBITDA, % | 0 | 0 | 0 | 0 | 40.02 | 8 | 8 | 8 | 8 | 8 |
| Depreciation | 1,373.1 | 1,472.3 | 1,561.9 | 1,868.4 | 1,794.5 | 2,146.0 | 2,502.5 | 2,918.3 | 3,403.1 | 3,968.5 |
| Depreciation, % | 4.6 | 2.9 | 3.4 | 5.02 | 3.86 | 3.96 | 3.96 | 3.96 | 3.96 | 3.96 |
| EBIT | -1,373.1 | -1,472.3 | -1,561.9 | -1,868.4 | 16,820.8 | 2,195.5 | 2,560.3 | 2,985.6 | 3,481.6 | 4,060.0 |
| EBIT, % | -4.6 | -2.9 | -3.4 | -5.02 | 36.16 | 4.05 | 4.05 | 4.05 | 4.05 | 4.05 |
| Total Cash | 338,131.1 | 365,978.3 | 370,015.1 | 378,570.5 | 424,604.0 | 54,247.7 | 63,259.7 | 73,768.9 | 86,024.0 | 100,315.0 |
| Total Cash, percent | .0 | .0 | .0 | .0 | .0 | .0 | .0 | .0 | .0 | .0 |
| Account Receivables | 9,965.6 | 11,271.1 | 8,550.8 | 10,675.8 | 6,121.7 | 12,592.7 | 14,684.7 | 17,124.3 | 19,969.1 | 23,286.5 |
| Account Receivables, % | 33.39 | 22.24 | 18.62 | 28.67 | 13.16 | 23.21 | 23.21 | 23.21 | 23.21 | 23.21 |
| Inventories | .0 | .0 | .0 | .0 | .0 | .0 | .0 | .0 | .0 | .0 |
| Inventories, % | 0 | 0 | 0 | 0 | 0 | 0 | 0 | 0 | 0 | 0 |
| Accounts Payable | 47,886.6 | 113,549.8 | 115,369.4 | 120,835.9 | 79,210.8 | 54,247.7 | 63,259.7 | 73,768.9 | 86,024.0 | 100,315.0 |
| Accounts Payable, % | 160.45 | 224 | 251.17 | 324.46 | 170.27 | 100 | 100 | 100 | 100 | 100 |
| Capital Expenditure | -1,103.4 | -3,235.6 | -1,568.8 | -1,836.6 | -1,978.8 | -2,460.8 | -2,869.6 | -3,346.3 | -3,902.2 | -4,550.5 |
| Capital Expenditure, % | -3.7 | -6.38 | -3.42 | -4.93 | -4.25 | -4.54 | -4.54 | -4.54 | -4.54 | -4.54 |
| Tax Rate, % | 0.0076731 | 0.0076731 | 0.0076731 | 0.0076731 | 0.0076731 | 0.0076731 | 0.0076731 | 0.0076731 | 0.0076731 | 0.0076731 |
| EBITAT | -1,100.4 | -1,207.5 | -1,411.9 | -1,677.1 | 16,819.5 | 1,942.2 | 2,264.9 | 2,641.1 | 3,079.9 | 3,591.6 |
| Depreciation | ||||||||||
| Changes in Account Receivables | ||||||||||
| Changes in Inventories | ||||||||||
| Changes in Accounts Payable | ||||||||||
| Capital Expenditure | ||||||||||
| UFCF | 37,090.3 | 61,386.8 | 3,121.1 | 1,696.2 | -20,435.8 | -29,806.7 | 8,817.9 | 10,282.8 | 11,991.0 | 13,983.1 |
| WACC, % | 8.35 | 8.44 | 8.84 | 8.81 | 9.29 | 8.74 | 8.74 | 8.74 | 8.74 | 8.74 |
| PV UFCF | ||||||||||
| SUM PV UFCF | 5,814.1 | |||||||||
| Long Term Growth Rate, % | 2.00 | |||||||||
| Free cash flow (T + 1) | 14,263 | |||||||||
| Terminal Value | 211,501 | |||||||||
| Present Terminal Value | 139,090 | |||||||||
| Enterprise Value | 144,904 | |||||||||
| Net Debt | 37,416 | |||||||||
| Equity Value | 107,488 | |||||||||
| Diluted Shares Outstanding, MM | 9,005 | |||||||||
| Equity Value Per Share | 11.94 |
What You Will Receive
- Adjustable Financial Inputs: Effortlessly modify key assumptions (growth %, profit margins, discount rate) to generate various scenarios.
- Market Data at Your Fingertips: Huatai Securities Co., Ltd. (6886HK) financial data pre-loaded to accelerate your analysis.
- Automated DCF Calculations: Our template calculates Net Present Value (NPV) and intrinsic value automatically for you.
- Customizable and Professional Design: A sleek Excel model tailored to fit your valuation requirements.
- Designed for Analysts and Investors: Perfect for evaluating projections, validating strategies, and enhancing efficiency.
Key Features
- Comprehensive 6886HK Data: Pre-filled with Huatai Securities’ historical financial performance and projected growth metrics.
- Completely Customizable Inputs: Modify revenue growth rates, profit margins, discount rates, tax percentages, and capital expenditure estimates.
- Advanced Valuation Model: Automatic recalculations of Net Present Value (NPV) and intrinsic value based on user-defined parameters.
- Scenario Analysis: Develop various forecasting models to assess different valuation scenarios.
- Intuitive User Interface: Thoughtfully designed to serve both industry professionals and newcomers.
How It Works
- Step 1: Download the Excel file.
- Step 2: Review Huatai Securities Co., Ltd.'s pre-filled financial data and forecasts.
- Step 3: Adjust key parameters such as revenue growth, WACC, and tax rates (highlighted cells).
- Step 4: Observe the DCF model update in real-time as you modify your assumptions.
- Step 5: Evaluate the results and use them to inform your investment decisions.
Why Choose Huatai Securities Co., Ltd. (6886HK)?
- Time Efficiency: Skip the hassle of building complex financial models from the ground up – our solutions are ready to implement.
- Enhanced Accuracy: Access dependable financial data and formulas that minimize valuation errors.
- Fully Adaptable: Customize the model to align with your unique assumptions and forecasts.
- User-Friendly Insights: Intuitive charts and outputs facilitate straightforward analysis of results.
- Preferred by Professionals: Crafted for experts who prioritize both precision and user experience.
Who Can Benefit from Huatai Securities Co., Ltd. (6886HK)?
- Institutional Investors: Construct comprehensive and trustworthy valuation models for portfolio evaluation.
- Corporate Finance Departments: Examine valuation scenarios to inform internal strategic planning.
- Financial Consultants and Advisors: Offer clients precise valuation insights for Huatai Securities Co., Ltd. (6886HK).
- Students and Educators: Leverage real-time data to practice and teach financial modeling techniques.
- Market Analysts: Gain insights into how financial firms like Huatai Securities Co., Ltd. (6886HK) are assessed in the market.
Contents of the Template
- Preloaded Huatai Securities Data: Historical and projected financial information, including revenue, EBIT, and capital expenditures.
- DCF and WACC Models: Expert-level sheets for calculating intrinsic value and Weighted Average Cost of Capital.
- Editable Inputs: Yellow-highlighted cells for modifying revenue growth, tax rates, and discount rates.
- Financial Statements: Detailed annual and quarterly financial statements for in-depth analysis.
- Key Ratios: Metrics for profitability, leverage, and efficiency to assess performance.
- Dashboard and Charts: Visual representations of valuation results and underlying assumptions.
Disclaimer
All information, articles, and product details provided on this website are for general informational and educational purposes only. We do not claim any ownership over, nor do we intend to infringe upon, any trademarks, copyrights, logos, brand names, or other intellectual property mentioned or depicted on this site. Such intellectual property remains the property of its respective owners, and any references here are made solely for identification or informational purposes, without implying any affiliation, endorsement, or partnership.
We make no representations or warranties, express or implied, regarding the accuracy, completeness, or suitability of any content or products presented. Nothing on this website should be construed as legal, tax, investment, financial, medical, or other professional advice. In addition, no part of this site—including articles or product references—constitutes a solicitation, recommendation, endorsement, advertisement, or offer to buy or sell any securities, franchises, or other financial instruments, particularly in jurisdictions where such activity would be unlawful.
All content is of a general nature and may not address the specific circumstances of any individual or entity. It is not a substitute for professional advice or services. Any actions you take based on the information provided here are strictly at your own risk. You accept full responsibility for any decisions or outcomes arising from your use of this website and agree to release us from any liability in connection with your use of, or reliance upon, the content or products found herein.