
|
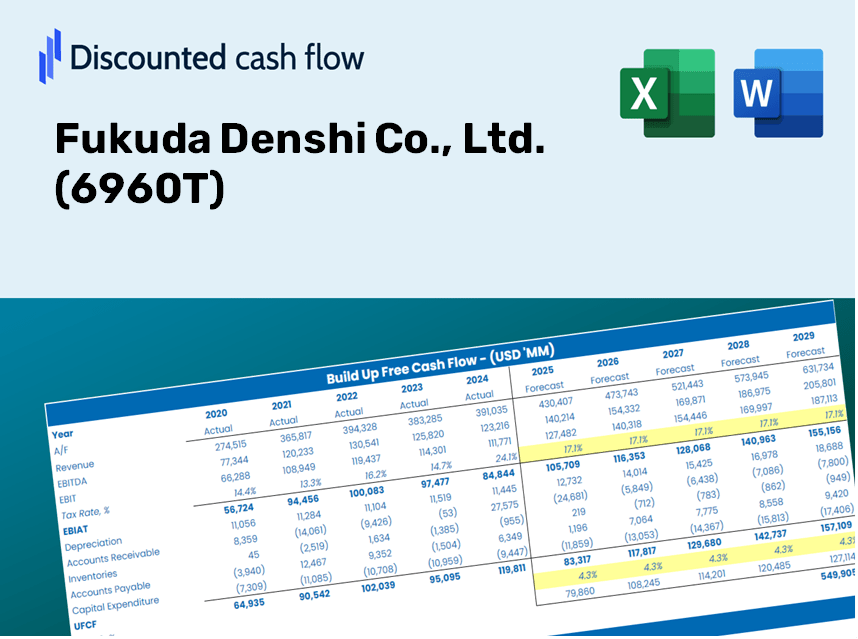
Fukuda Denshi Co., Ltd. (6960.T) DCF Valuation |
Fully Editable: Tailor To Your Needs In Excel Or Sheets
Professional Design: Trusted, Industry-Standard Templates
Investor-Approved Valuation Models
MAC/PC Compatible, Fully Unlocked
No Expertise Is Needed; Easy To Follow
Fukuda Denshi Co., Ltd. (6960.T) Bundle
Enhance your investment strategies with the Fukuda Denshi Co., Ltd. (6960T) DCF Calculator! Utilize authentic financial data, adjust growth predictions and expenses, and immediately observe the effects of these changes on the intrinsic value of Fukuda Denshi Co., Ltd. (6960T).
Discounted Cash Flow (DCF) - (USD MM)
| Year | AY1 2020 |
AY2 2021 |
AY3 2022 |
AY4 2023 |
AY5 2024 |
FY1 2025 |
FY2 2026 |
FY3 2027 |
FY4 2028 |
FY5 2029 |
|---|---|---|---|---|---|---|---|---|---|---|
| Revenue | 146,756.0 | 132,098.0 | 134,648.0 | 140,323.0 | 139,007.0 | 137,345.6 | 135,704.1 | 134,082.1 | 132,479.6 | 130,896.2 |
| Revenue Growth, % | 0 | -9.99 | 1.93 | 4.21 | -0.93784 | -1.2 | -1.2 | -1.2 | -1.2 | -1.2 |
| EBITDA | 29,429.0 | 32,777.0 | 34,607.0 | 36,746.0 | 37,727.0 | 34,032.7 | 33,626.0 | 33,224.1 | 32,827.0 | 32,434.7 |
| EBITDA, % | 20.05 | 24.81 | 25.7 | 26.19 | 27.14 | 24.78 | 24.78 | 24.78 | 24.78 | 24.78 |
| Depreciation | 8,360.0 | 9,016.0 | 9,368.0 | 9,725.0 | 10,549.0 | 9,339.1 | 9,227.5 | 9,117.2 | 9,008.2 | 8,900.5 |
| Depreciation, % | 5.7 | 6.83 | 6.96 | 6.93 | 7.59 | 6.8 | 6.8 | 6.8 | 6.8 | 6.8 |
| EBIT | 21,069.0 | 23,761.0 | 25,239.0 | 27,021.0 | 27,178.0 | 24,693.7 | 24,398.5 | 24,106.9 | 23,818.8 | 23,534.1 |
| EBIT, % | 14.36 | 17.99 | 18.74 | 19.26 | 19.55 | 17.98 | 17.98 | 17.98 | 17.98 | 17.98 |
| Total Cash | 58,073.0 | 64,554.0 | 68,466.0 | 60,222.0 | 72,374.0 | 64,351.7 | 63,582.6 | 62,822.6 | 62,071.8 | 61,329.9 |
| Total Cash, percent | .0 | .0 | .0 | .0 | .0 | .0 | .0 | .0 | .0 | .0 |
| Account Receivables | 45,903.0 | 39,427.0 | 41,095.0 | 41,179.0 | 39,024.0 | 40,946.8 | 40,457.4 | 39,973.9 | 39,496.1 | 39,024.0 |
| Account Receivables, % | 31.28 | 29.85 | 30.52 | 29.35 | 28.07 | 29.81 | 29.81 | 29.81 | 29.81 | 29.81 |
| Inventories | 12,835.0 | 13,536.0 | 15,598.0 | 15,656.0 | 13,295.0 | 14,091.2 | 13,922.8 | 13,756.4 | 13,592.0 | 13,429.5 |
| Inventories, % | 8.75 | 10.25 | 11.58 | 11.16 | 9.56 | 10.26 | 10.26 | 10.26 | 10.26 | 10.26 |
| Accounts Payable | 29,439.0 | 22,149.0 | 18,879.0 | 11,611.0 | 15,588.0 | 19,320.7 | 19,089.8 | 18,861.7 | 18,636.2 | 18,413.5 |
| Accounts Payable, % | 20.06 | 16.77 | 14.02 | 8.27 | 11.21 | 14.07 | 14.07 | 14.07 | 14.07 | 14.07 |
| Capital Expenditure | -11,852.0 | -14,358.0 | -12,539.0 | -14,123.0 | -12,496.0 | -12,996.1 | -12,840.8 | -12,687.3 | -12,535.7 | -12,385.9 |
| Capital Expenditure, % | -8.08 | -10.87 | -9.31 | -10.06 | -8.99 | -9.46 | -9.46 | -9.46 | -9.46 | -9.46 |
| Tax Rate, % | 31.42 | 31.42 | 31.42 | 31.42 | 31.42 | 31.42 | 31.42 | 31.42 | 31.42 | 31.42 |
| EBITAT | 14,743.3 | 16,241.3 | 17,303.4 | 18,717.2 | 18,640.0 | 17,025.8 | 16,822.4 | 16,621.3 | 16,422.6 | 16,226.4 |
| Depreciation | ||||||||||
| Changes in Account Receivables | ||||||||||
| Changes in Inventories | ||||||||||
| Changes in Accounts Payable | ||||||||||
| Capital Expenditure | ||||||||||
| UFCF | -18,047.7 | 9,384.3 | 7,132.4 | 6,909.2 | 25,186.0 | 14,382.5 | 13,635.9 | 13,472.9 | 13,311.9 | 13,152.8 |
| WACC, % | 5.89 | 5.89 | 5.89 | 5.89 | 5.89 | 5.89 | 5.89 | 5.89 | 5.89 | 5.89 |
| PV UFCF | ||||||||||
| SUM PV UFCF | 57,554.5 | |||||||||
| Long Term Growth Rate, % | 0.50 | |||||||||
| Free cash flow (T + 1) | 13,219 | |||||||||
| Terminal Value | 245,112 | |||||||||
| Present Terminal Value | 184,090 | |||||||||
| Enterprise Value | 241,645 | |||||||||
| Net Debt | -69,057 | |||||||||
| Equity Value | 310,702 | |||||||||
| Diluted Shares Outstanding, MM | 29 | |||||||||
| Equity Value Per Share | 10,777.77 |
What You Will Receive
- Pre-Filled Financial Model: Utilize Fukuda Denshi’s actual data for accurate DCF valuation.
- Comprehensive Forecast Control: Modify revenue growth, margins, WACC, and other essential metrics.
- Real-Time Calculations: Instantaneous updates allow you to view results immediately as you make adjustments.
- Professional-Grade Template: An enhanced Excel file created for high-quality valuation presentations.
- Customizable and Reusable: Designed for adaptability, enabling repeated applications for in-depth forecasts.
Key Features
- Authentic Financial Data for Fukuda Denshi: Gain access to reliable historical records and future forecasts.
- Adjustable Forecast Variables: Modify highlighted fields such as WACC, growth rates, and profit margins.
- Real-Time Calculations: Automatic updates for DCF, Net Present Value (NPV), and cash flow assessments.
- User-Friendly Dashboard: Clear visual charts and summaries to help interpret your valuation findings.
- Designed for All Skill Levels: An intuitive layout catering to investors, CFOs, and consultants alike.
How It Functions
- Download the Template: Gain immediate access to the Excel-based Fukuda Denshi DCF Calculator for (6960T).
- Enter Your Assumptions: Modify the yellow-highlighted cells for growth rates, WACC, profit margins, and additional parameters.
- Real-Time Calculations: The model instantly recalculates the intrinsic value of Fukuda Denshi.
- Explore Different Scenarios: Test various assumptions to assess how valuations may shift.
- Evaluate and Decide: Utilize the findings to inform your investment strategy or financial analysis.
Why Select This Calculator for Fukuda Denshi Co., Ltd. (6960T)?
- Reliable Data: Utilize accurate financial information from Fukuda Denshi to achieve trustworthy valuation outcomes.
- Flexible Customization: Modify essential parameters such as growth rates, WACC, and tax rates to align with your forecasts.
- Efficiency Boost: Built-in calculations save you the hassle of starting from square one.
- Professional Quality: Tailored for use by investors, analysts, and consultants in the field.
- Easy to Use: The user-friendly design and guided instructions ensure usability for everyone.
Who Should Consider This Product?
- Investors: Evaluate Fukuda Denshi Co., Ltd.’s (6960T) valuation before making stock transactions.
- CFOs and Financial Analysts: Enhance valuation methodologies and assess future projections.
- Startup Founders: Discover the valuation tactics used for established firms like Fukuda Denshi Co., Ltd. (6960T).
- Consultants: Provide clients with comprehensive valuation analyses and reports.
- Students and Educators: Utilize current market data to practice and instruct on valuation strategies.
Contents of the Template
- Included Data: Features Fukuda Denshi’s historical financial performance and projections.
- Discounted Cash Flow Model: An editable DCF valuation model with automated calculations.
- Weighted Average Cost of Capital (WACC): A dedicated worksheet for WACC calculation based on user-defined inputs.
- Essential Financial Ratios: Examine Fukuda Denshi’s profitability, efficiency, and leverage metrics.
- Customizable Parameters: Easily modify revenue growth rates, profit margins, and tax percentages.
- User-Friendly Dashboard: Visual representations and tables summarizing key valuation metrics.
Disclaimer
All information, articles, and product details provided on this website are for general informational and educational purposes only. We do not claim any ownership over, nor do we intend to infringe upon, any trademarks, copyrights, logos, brand names, or other intellectual property mentioned or depicted on this site. Such intellectual property remains the property of its respective owners, and any references here are made solely for identification or informational purposes, without implying any affiliation, endorsement, or partnership.
We make no representations or warranties, express or implied, regarding the accuracy, completeness, or suitability of any content or products presented. Nothing on this website should be construed as legal, tax, investment, financial, medical, or other professional advice. In addition, no part of this site—including articles or product references—constitutes a solicitation, recommendation, endorsement, advertisement, or offer to buy or sell any securities, franchises, or other financial instruments, particularly in jurisdictions where such activity would be unlawful.
All content is of a general nature and may not address the specific circumstances of any individual or entity. It is not a substitute for professional advice or services. Any actions you take based on the information provided here are strictly at your own risk. You accept full responsibility for any decisions or outcomes arising from your use of this website and agree to release us from any liability in connection with your use of, or reliance upon, the content or products found herein.