
|
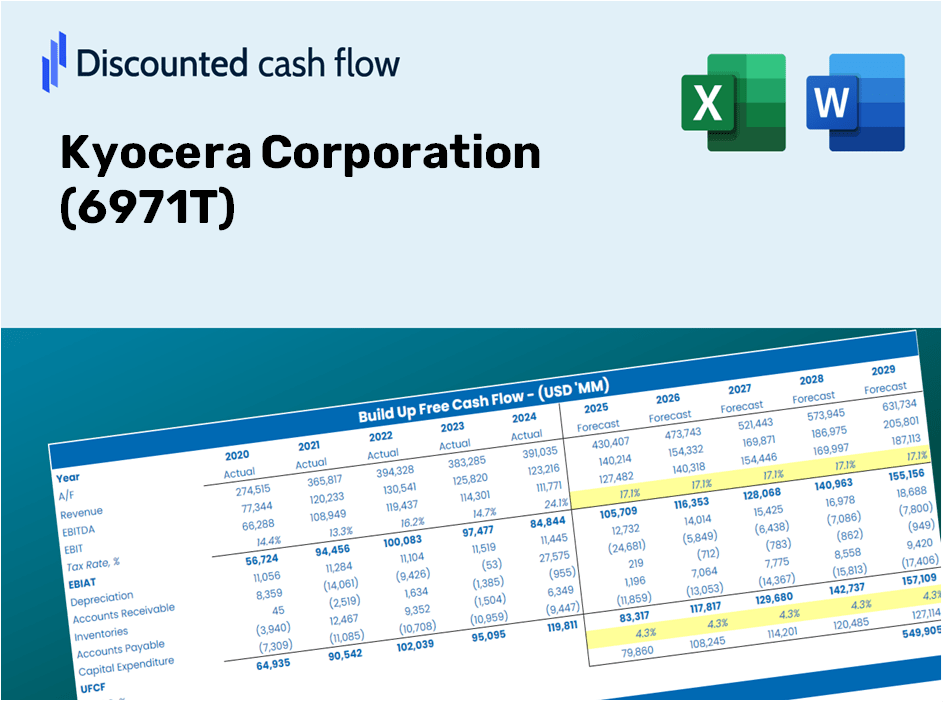
Kyocera Corporation (6971.T) DCF Valuation |
Fully Editable: Tailor To Your Needs In Excel Or Sheets
Professional Design: Trusted, Industry-Standard Templates
Investor-Approved Valuation Models
MAC/PC Compatible, Fully Unlocked
No Expertise Is Needed; Easy To Follow
Kyocera Corporation (6971.T) Bundle
Evaluate Kyocera Corporation's (6971T) financial outlook like an expert! This (6971T) DCF Calculator offers pre-populated financial data along with the flexibility to modify revenue growth, WACC, margins, and other essential assumptions to align with your projections.
Discounted Cash Flow (DCF) - (USD MM)
| Year | AY1 2021 |
AY2 2022 |
AY3 2023 |
AY4 2024 |
AY5 2025 |
FY1 2026 |
FY2 2027 |
FY3 2028 |
FY4 2029 |
FY5 2030 |
|---|---|---|---|---|---|---|---|---|---|---|
| Revenue | 1,526,897.0 | 1,838,938.0 | 2,025,332.0 | 2,004,221.0 | 2,014,454.0 | 1,973,611.0 | 1,933,596.0 | 1,894,392.4 | 1,855,983.6 | 1,818,353.6 |
| Revenue Growth, % | 0 | 20.44 | 10.14 | -1.04 | 0.51057 | -2.03 | -2.03 | -2.03 | -2.03 | -2.03 |
| EBITDA | 228,811.0 | 330,657.0 | 328,257.0 | 220,115.0 | 252,211.0 | 286,870.0 | 281,053.7 | 275,355.4 | 269,772.5 | 264,302.9 |
| EBITDA, % | 14.99 | 17.98 | 16.21 | 10.98 | 12.52 | 14.54 | 14.54 | 14.54 | 14.54 | 14.54 |
| Depreciation | 109,058.0 | 128,960.0 | 149,603.0 | 127,192.0 | 160,927.0 | 141,613.0 | 138,741.8 | 135,928.8 | 133,172.8 | 130,472.7 |
| Depreciation, % | 7.14 | 7.01 | 7.39 | 6.35 | 7.99 | 7.18 | 7.18 | 7.18 | 7.18 | 7.18 |
| EBIT | 119,753.0 | 201,697.0 | 178,654.0 | 92,923.0 | 91,284.0 | 145,257.0 | 142,311.9 | 139,426.6 | 136,599.7 | 133,830.1 |
| EBIT, % | 7.84 | 10.97 | 8.82 | 4.64 | 4.53 | 7.36 | 7.36 | 7.36 | 7.36 | 7.36 |
| Total Cash | 484,083.0 | 458,212.0 | 396,902.0 | 460,333.0 | 473,387.0 | 484,266.9 | 474,448.4 | 464,828.9 | 455,404.5 | 446,171.2 |
| Total Cash, percent | .0 | .0 | .0 | .0 | .0 | .0 | .0 | .0 | .0 | .0 |
| Account Receivables | 303,835.0 | 338,721.0 | 337,454.0 | 344,821.0 | 382,584.0 | 359,894.2 | 352,597.4 | 345,448.4 | 338,444.5 | 331,582.5 |
| Account Receivables, % | 19.9 | 18.42 | 16.66 | 17.2 | 18.99 | 18.24 | 18.24 | 18.24 | 18.24 | 18.24 |
| Inventories | 345,354.0 | 452,506.0 | 539,441.0 | 540,225.0 | 521,813.0 | 500,181.9 | 490,040.7 | 480,105.2 | 470,371.0 | 460,834.3 |
| Inventories, % | 22.62 | 24.61 | 26.63 | 26.95 | 25.9 | 25.34 | 25.34 | 25.34 | 25.34 | 25.34 |
| Accounts Payable | 183,145.0 | 222,962.0 | 203,864.0 | 212,133.0 | 207,029.0 | 217,279.9 | 212,874.5 | 208,558.5 | 204,330.0 | 200,187.2 |
| Accounts Payable, % | 11.99 | 12.12 | 10.07 | 10.58 | 10.28 | 11.01 | 11.01 | 11.01 | 11.01 | 11.01 |
| Capital Expenditure | -132,126.0 | -146,902.0 | -186,643.0 | -159,739.0 | -167,844.0 | -166,411.7 | -163,037.7 | -159,732.1 | -156,493.5 | -153,320.6 |
| Capital Expenditure, % | -8.65 | -7.99 | -9.22 | -7.97 | -8.33 | -8.43 | -8.43 | -8.43 | -8.43 | -8.43 |
| Tax Rate, % | 62.13 | 62.13 | 62.13 | 62.13 | 62.13 | 62.13 | 62.13 | 62.13 | 62.13 | 62.13 |
| EBITAT | 91,897.7 | 150,465.5 | 129,776.4 | 68,987.0 | 34,569.2 | 97,639.2 | 95,659.6 | 93,720.1 | 91,819.9 | 89,958.3 |
| Depreciation | ||||||||||
| Changes in Account Receivables | ||||||||||
| Changes in Inventories | ||||||||||
| Changes in Accounts Payable | ||||||||||
| Capital Expenditure | ||||||||||
| UFCF | -397,214.3 | 30,302.5 | -12,029.6 | 36,558.0 | 3,197.2 | 127,412.3 | 84,396.4 | 82,685.2 | 81,008.8 | 79,366.3 |
| WACC, % | 4.83 | 4.81 | 4.79 | 4.81 | 4.49 | 4.75 | 4.75 | 4.75 | 4.75 | 4.75 |
| PV UFCF | ||||||||||
| SUM PV UFCF | 400,745.0 | |||||||||
| Long Term Growth Rate, % | 2.00 | |||||||||
| Free cash flow (T + 1) | 80,954 | |||||||||
| Terminal Value | 2,947,889 | |||||||||
| Present Terminal Value | 2,337,872 | |||||||||
| Enterprise Value | 2,738,617 | |||||||||
| Net Debt | -102,362 | |||||||||
| Equity Value | 2,840,979 | |||||||||
| Diluted Shares Outstanding, MM | 1,409 | |||||||||
| Equity Value Per Share | 2,016.71 |
What You Will Receive
- Genuine KYOCERA Financial Data: Pre-populated with Kyocera’s historical and forecasted metrics for accurate evaluation.
- Completely Customizable Template: Easily adjust core inputs such as revenue growth, WACC, and EBITDA percentage.
- Instant Calculations: Observe real-time updates to Kyocera’s intrinsic value as you modify inputs.
- Expert Valuation Tool: Tailored for investors, analysts, and consultants in pursuit of precise DCF outcomes.
- Intuitive Design: Straightforward layout and clear guidance suitable for users of all skill levels.
Key Features
- Real-Time KYOCERA Data: Pre-populated with Kyocera's historical financials and future projections.
- Customizable Inputs: Tailor revenue growth, profit margins, WACC, tax rates, and capital expenditures to fit your analysis.
- Dynamic Valuation Mechanism: Instant updates to Net Present Value (NPV) and intrinsic value based on your adjustments.
- Scenario Analysis: Generate various forecasting scenarios to evaluate different valuation possibilities.
- User-Centric Interface: Intuitive and organized layout, suitable for both professionals and novices.
How It Works
- Step 1: Download the ready-to-use Excel template featuring Kyocera Corporation’s data.
- Step 2: Review the pre-filled sheets to familiarize yourself with the essential metrics.
- Step 3: Adjust forecasts and assumptions in the editable yellow cells (WACC, growth rates, margins).
- Step 4: Immediately see the updated results, including Kyocera Corporation's intrinsic value.
- Step 5: Utilize the outputs to make informed investment choices or create detailed reports.
Why Opt for This Calculator?
- Designed for Experts: A sophisticated tool utilized by analysts, CFOs, and consultants.
- Accurate Data: Kyocera’s historical and projected financial figures preloaded for precision.
- Forecast Simulation: Effortlessly test various scenarios and assumptions.
- Transparent Results: Automatically computes intrinsic value, NPV, and essential metrics.
- User-Friendly: Step-by-step guidance simplifies the entire process.
Who Can Benefit from This Product?
- Professional Investors: Develop comprehensive and trustworthy valuation models for portfolio assessments related to Kyocera Corporation (6971T).
- Corporate Finance Teams: Examine valuation scenarios that inform the company's internal strategies.
- Consultants and Advisors: Equip clients with precise valuation insights regarding Kyocera Corporation (6971T).
- Students and Educators: Leverage real-world data to enhance learning and practice in financial modeling.
- Tech Enthusiasts: Explore how technology firms like Kyocera Corporation (6971T) are evaluated in the marketplace.
What the Template Contains
- Historical Data: Comprises Kyocera Corporation’s past financial performance and baseline forecasts.
- DCF and Levered DCF Models: Comprehensive templates to assess the intrinsic value of Kyocera Corporation (6971T).
- WACC Sheet: Pre-configured calculations for Weighted Average Cost of Capital.
- Editable Inputs: Adjust key parameters such as growth rates, EBITDA %, and CAPEX assumptions.
- Quarterly and Annual Statements: An extensive analysis of Kyocera Corporation’s financials.
- Interactive Dashboard: Dynamically visualize valuation results and forecasts.
Disclaimer
All information, articles, and product details provided on this website are for general informational and educational purposes only. We do not claim any ownership over, nor do we intend to infringe upon, any trademarks, copyrights, logos, brand names, or other intellectual property mentioned or depicted on this site. Such intellectual property remains the property of its respective owners, and any references here are made solely for identification or informational purposes, without implying any affiliation, endorsement, or partnership.
We make no representations or warranties, express or implied, regarding the accuracy, completeness, or suitability of any content or products presented. Nothing on this website should be construed as legal, tax, investment, financial, medical, or other professional advice. In addition, no part of this site—including articles or product references—constitutes a solicitation, recommendation, endorsement, advertisement, or offer to buy or sell any securities, franchises, or other financial instruments, particularly in jurisdictions where such activity would be unlawful.
All content is of a general nature and may not address the specific circumstances of any individual or entity. It is not a substitute for professional advice or services. Any actions you take based on the information provided here are strictly at your own risk. You accept full responsibility for any decisions or outcomes arising from your use of this website and agree to release us from any liability in connection with your use of, or reliance upon, the content or products found herein.