
|
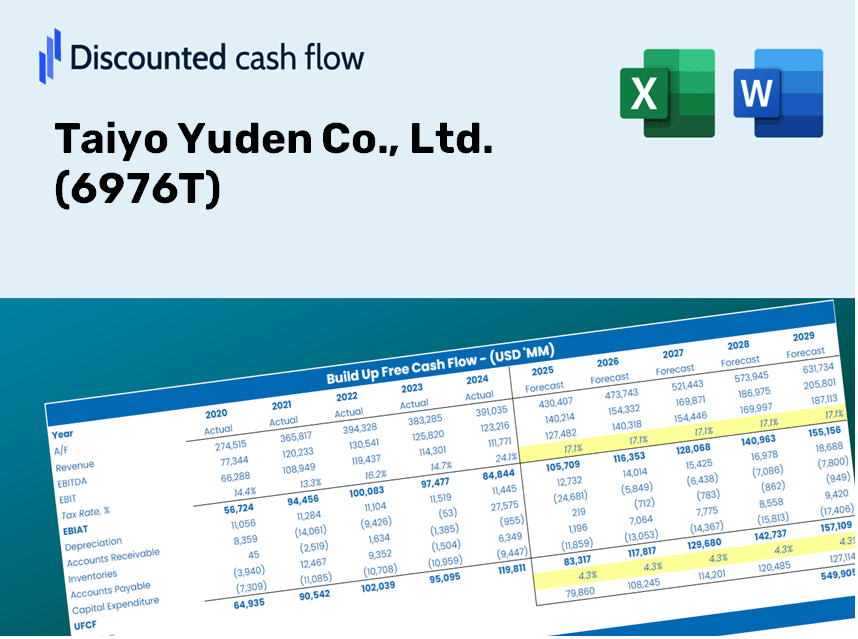
Taiyo Yuden Co., Ltd. (6976.T) DCF Valuation |
Fully Editable: Tailor To Your Needs In Excel Or Sheets
Professional Design: Trusted, Industry-Standard Templates
Investor-Approved Valuation Models
MAC/PC Compatible, Fully Unlocked
No Expertise Is Needed; Easy To Follow
Taiyo Yuden Co., Ltd. (6976.T) Bundle
Whether you’re an investor or analyst, this (6976T) DCF Calculator is your ultimate tool for accurate valuation. Preloaded with Taiyo Yuden Co., Ltd. real data, you can adjust forecasts and instantly observe the effects.
Discounted Cash Flow (DCF) - (USD MM)
| Year | AY1 2021 |
AY2 2022 |
AY3 2023 |
AY4 2024 |
AY5 2025 |
FY1 2026 |
FY2 2027 |
FY3 2028 |
FY4 2029 |
FY5 2030 |
|---|---|---|---|---|---|---|---|---|---|---|
| Revenue | 300,920.0 | 349,636.0 | 319,504.0 | 322,647.0 | 341,438.0 | 353,711.5 | 366,426.3 | 379,598.0 | 393,243.3 | 407,379.1 |
| Revenue Growth, % | 0 | 16.19 | -8.62 | 0.98371 | 5.82 | 3.59 | 3.59 | 3.59 | 3.59 | 3.59 |
| EBITDA | 66,634.0 | 103,549.0 | 66,468.0 | 53,278.0 | 56,422.0 | 74,704.4 | 77,389.8 | 80,171.7 | 83,053.6 | 86,039.1 |
| EBITDA, % | 22.14 | 29.62 | 20.8 | 16.51 | 16.52 | 21.12 | 21.12 | 21.12 | 21.12 | 21.12 |
| Depreciation | 29,256.0 | 31,287.0 | 34,903.0 | 39,391.0 | 46,258.0 | 39,156.9 | 40,564.4 | 42,022.6 | 43,533.2 | 45,098.0 |
| Depreciation, % | 9.72 | 8.95 | 10.92 | 12.21 | 13.55 | 11.07 | 11.07 | 11.07 | 11.07 | 11.07 |
| EBIT | 37,378.0 | 72,262.0 | 31,565.0 | 13,887.0 | 10,164.0 | 35,547.5 | 36,825.3 | 38,149.1 | 39,520.4 | 40,941.0 |
| EBIT, % | 12.42 | 20.67 | 9.88 | 4.3 | 2.98 | 10.05 | 10.05 | 10.05 | 10.05 | 10.05 |
| Total Cash | 84,297.0 | 92,570.0 | 87,197.0 | 102,783.0 | 78,166.0 | 96,584.4 | 100,056.3 | 103,653.0 | 107,378.9 | 111,238.9 |
| Total Cash, percent | .0 | .0 | .0 | .0 | .0 | .0 | .0 | .0 | .0 | .0 |
| Account Receivables | 78,491.0 | 86,274.0 | 70,114.0 | 80,894.0 | 80,222.0 | 85,789.9 | 88,873.8 | 92,068.5 | 95,378.0 | 98,806.5 |
| Account Receivables, % | 26.08 | 24.68 | 21.94 | 25.07 | 23.5 | 24.25 | 24.25 | 24.25 | 24.25 | 24.25 |
| Inventories | 67,934.0 | 96,780.0 | 104,814.0 | 102,336.0 | 110,026.0 | 103,993.2 | 107,731.4 | 111,604.0 | 115,615.7 | 119,771.7 |
| Inventories, % | 22.58 | 27.68 | 32.81 | 31.72 | 32.22 | 29.4 | 29.4 | 29.4 | 29.4 | 29.4 |
| Accounts Payable | 31,728.0 | 32,828.0 | 23,012.0 | 29,745.0 | 27,157.0 | 31,344.5 | 32,471.3 | 33,638.5 | 34,847.7 | 36,100.3 |
| Accounts Payable, % | 10.54 | 9.39 | 7.2 | 9.22 | 7.95 | 8.86 | 8.86 | 8.86 | 8.86 | 8.86 |
| Capital Expenditure | -43,908.0 | -51,551.0 | -63,338.0 | -79,907.0 | -62,715.0 | -65,290.4 | -67,637.4 | -70,068.7 | -72,587.4 | -75,196.7 |
| Capital Expenditure, % | -14.59 | -14.74 | -19.82 | -24.77 | -18.37 | -18.46 | -18.46 | -18.46 | -18.46 | -18.46 |
| Tax Rate, % | 72.17 | 72.17 | 72.17 | 72.17 | 72.17 | 72.17 | 72.17 | 72.17 | 72.17 | 72.17 |
| EBITAT | 28,899.5 | 54,656.0 | 23,561.6 | 8,834.9 | 2,829.0 | 22,682.9 | 23,498.3 | 24,343.0 | 25,218.0 | 26,124.5 |
| Depreciation | ||||||||||
| Changes in Account Receivables | ||||||||||
| Changes in Inventories | ||||||||||
| Changes in Accounts Payable | ||||||||||
| Capital Expenditure | ||||||||||
| UFCF | -100,449.5 | -1,137.0 | -6,563.4 | -33,250.1 | -23,234.0 | 1,201.9 | -9,269.9 | -9,603.2 | -9,948.4 | -10,306.0 |
| WACC, % | 6.08 | 6.06 | 6.05 | 5.94 | 5.58 | 5.94 | 5.94 | 5.94 | 5.94 | 5.94 |
| PV UFCF | ||||||||||
| SUM PV UFCF | -30,821.7 | |||||||||
| Long Term Growth Rate, % | 3.50 | |||||||||
| Free cash flow (T + 1) | -10,667 | |||||||||
| Terminal Value | -436,974 | |||||||||
| Present Terminal Value | -327,442 | |||||||||
| Enterprise Value | -358,263 | |||||||||
| Net Debt | 96,857 | |||||||||
| Equity Value | -455,120 | |||||||||
| Diluted Shares Outstanding, MM | 137 | |||||||||
| Equity Value Per Share | -3,331.09 |
What You Will Receive
- Flexible Financial Inputs: Easily adjust parameters (growth %, profit margins, WACC) to create various scenarios.
- Real-Time Data: Taiyo Yuden's financial information pre-filled to accelerate your analysis.
- Automated DCF Calculations: The template computes Net Present Value (NPV) and intrinsic value for you.
- Customizable and Professional Design: A sleek Excel model tailored to meet your valuation requirements.
- Engineered for Analysts and Investors: Perfect for testing forecasts, validating strategies, and optimizing your time.
Key Features
- Customizable Financial Inputs: Adjust essential parameters such as revenue growth, EBITDA margin, and capital expenditures.
- Instant DCF Valuation: Automatically computes intrinsic value, NPV, and other financial indicators in real-time.
- High-Precision Accuracy: Leverages Taiyo Yuden Co., Ltd.'s (6976T) actual financial data for dependable valuation results.
- Streamlined Scenario Analysis: Effortlessly explore various assumptions and evaluate different outcomes.
- Efficiency Booster: Saves time by eliminating the need to create intricate valuation models from the ground up.
How It Works
- Step 1: Download the Excel file.
- Step 2: Review the pre-filled data for Taiyo Yuden Co., Ltd. (6976T) - both historical and projected.
- Step 3: Modify the key assumptions (highlighted in yellow) according to your analysis.
- Step 4: Observe the automatic calculations for Taiyo Yuden's intrinsic value.
- Step 5: Utilize the results for your investment decisions or reporting needs.
Why Choose This Calculator for Taiyo Yuden Co., Ltd. (6976T)?
- All-in-One Solution: Features DCF, WACC, and a range of financial ratio analyses together.
- Flexible Inputs: Modify the yellow-highlighted cells to explore different financial scenarios.
- In-Depth Analysis: Automatically computes Taiyo Yuden’s intrinsic value and Net Present Value.
- Integrative Data: Comes with historical and projected data to provide reliable starting points.
- High-Quality Standards: Perfect for financial analysts, investors, and business consultants focused on Taiyo Yuden Co., Ltd.
Who Can Benefit from This Product?
- Professional Investors: Develop comprehensive and accurate valuation models for investment analysis of Taiyo Yuden Co., Ltd. (6976T).
- Corporate Finance Teams: Evaluate valuation scenarios to inform business strategies within their organizations.
- Consultants and Advisors: Deliver precise valuation insights regarding Taiyo Yuden Co., Ltd. (6976T) to clients.
- Students and Educators: Utilize real-world data to enhance learning and practice in financial modeling.
- Tech Enthusiasts: Gain insights into how tech companies like Taiyo Yuden Co., Ltd. (6976T) are valued in the marketplace.
Contents of the Template
- Operating and Balance Sheet Data: Pre-filled historical data and forecasts for Taiyo Yuden Co., Ltd. (6976T), including revenue, EBITDA, EBIT, and capital expenditures.
- WACC Calculation: A dedicated worksheet for calculating the Weighted Average Cost of Capital (WACC), featuring parameters such as Beta, risk-free rate, and share price.
- DCF Valuation (Unlevered and Levered): Customizable Discounted Cash Flow models that present intrinsic value along with comprehensive calculations.
- Financial Statements: Pre-loaded financial statements (both annual and quarterly) to facilitate thorough analysis.
- Key Ratios: A collection of key ratios, including profitability, leverage, and efficiency metrics for Taiyo Yuden Co., Ltd. (6976T).
- Dashboard and Charts: A visual overview of valuation outputs and assumptions, simplifying result analysis.
Disclaimer
All information, articles, and product details provided on this website are for general informational and educational purposes only. We do not claim any ownership over, nor do we intend to infringe upon, any trademarks, copyrights, logos, brand names, or other intellectual property mentioned or depicted on this site. Such intellectual property remains the property of its respective owners, and any references here are made solely for identification or informational purposes, without implying any affiliation, endorsement, or partnership.
We make no representations or warranties, express or implied, regarding the accuracy, completeness, or suitability of any content or products presented. Nothing on this website should be construed as legal, tax, investment, financial, medical, or other professional advice. In addition, no part of this site—including articles or product references—constitutes a solicitation, recommendation, endorsement, advertisement, or offer to buy or sell any securities, franchises, or other financial instruments, particularly in jurisdictions where such activity would be unlawful.
All content is of a general nature and may not address the specific circumstances of any individual or entity. It is not a substitute for professional advice or services. Any actions you take based on the information provided here are strictly at your own risk. You accept full responsibility for any decisions or outcomes arising from your use of this website and agree to release us from any liability in connection with your use of, or reliance upon, the content or products found herein.