
|
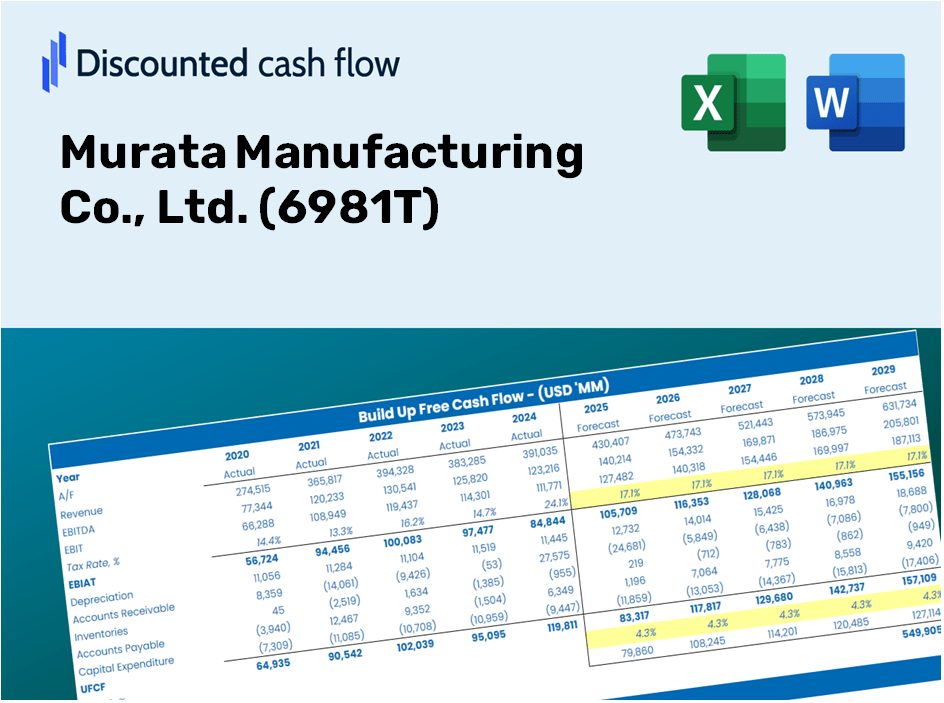
Murata Manufacturing Co., Ltd. (6981.T) DCF Valuation |
Fully Editable: Tailor To Your Needs In Excel Or Sheets
Professional Design: Trusted, Industry-Standard Templates
Investor-Approved Valuation Models
MAC/PC Compatible, Fully Unlocked
No Expertise Is Needed; Easy To Follow
Murata Manufacturing Co., Ltd. (6981.T) Bundle
Streamline Murata Manufacturing Co., Ltd. (6981T) valuation with this customizable DCF Calculator! Equipped with real Murata Manufacturing Co., Ltd. (6981T) financials and adjustable forecast inputs, you can explore scenarios and determine Murata Manufacturing Co., Ltd. (6981T) fair value in just minutes.
Discounted Cash Flow (DCF) - (USD MM)
| Year | AY1 2021 |
AY2 2022 |
AY3 2023 |
AY4 2024 |
AY5 2025 |
FY1 2026 |
FY2 2027 |
FY3 2028 |
FY4 2029 |
FY5 2030 |
|---|---|---|---|---|---|---|---|---|---|---|
| Revenue | 1,630,193.0 | 1,812,521.0 | 1,686,796.0 | 1,640,158.0 | 1,743,352.0 | 1,777,237.5 | 1,811,781.7 | 1,846,997.2 | 1,882,897.3 | 1,919,495.2 |
| Revenue Growth, % | 0 | 11.18 | -6.94 | -2.76 | 6.29 | 1.94 | 1.94 | 1.94 | 1.94 | 1.94 |
| EBITDA | 459,875.0 | 588,603.0 | 473,471.0 | 418,492.0 | 480,609.0 | 504,155.4 | 513,954.7 | 523,944.4 | 534,128.3 | 544,510.2 |
| EBITDA, % | 28.21 | 32.47 | 28.07 | 25.52 | 27.57 | 28.37 | 28.37 | 28.37 | 28.37 | 28.37 |
| Depreciation | 143,074.0 | 155,583.0 | 169,618.0 | 175,873.0 | 173,335.0 | 170,904.4 | 174,226.3 | 177,612.7 | 181,065.0 | 184,584.4 |
| Depreciation, % | 8.78 | 8.58 | 10.06 | 10.72 | 9.94 | 9.62 | 9.62 | 9.62 | 9.62 | 9.62 |
| EBIT | 316,801.0 | 433,020.0 | 303,853.0 | 242,619.0 | 307,274.0 | 333,251.0 | 339,728.4 | 346,331.7 | 353,063.3 | 359,925.8 |
| EBIT, % | 19.43 | 23.89 | 18.01 | 14.79 | 17.63 | 18.75 | 18.75 | 18.75 | 18.75 | 18.75 |
| Total Cash | 450,796.0 | 568,441.0 | 469,406.0 | 622,007.0 | 625,148.0 | 570,939.9 | 582,037.2 | 593,350.3 | 604,883.2 | 616,640.3 |
| Total Cash, percent | .0 | .0 | .0 | .0 | .0 | .0 | .0 | .0 | .0 | .0 |
| Account Receivables | 340,871.0 | 358,310.0 | 270,239.0 | 292,736.0 | 294,419.0 | 325,005.0 | 331,322.1 | 337,762.0 | 344,327.1 | 351,019.8 |
| Account Receivables, % | 20.91 | 19.77 | 16.02 | 17.85 | 16.89 | 18.29 | 18.29 | 18.29 | 18.29 | 18.29 |
| Inventories | 361,331.0 | 464,723.0 | 574,632.0 | 513,024.0 | 482,833.0 | 500,632.2 | 510,362.9 | 520,282.9 | 530,395.6 | 540,704.9 |
| Inventories, % | 22.16 | 25.64 | 34.07 | 31.28 | 27.7 | 28.17 | 28.17 | 28.17 | 28.17 | 28.17 |
| Accounts Payable | 85,927.0 | 93,842.0 | 65,597.0 | 67,620.0 | 69,617.0 | 79,809.7 | 81,361.0 | 82,942.4 | 84,554.6 | 86,198.0 |
| Accounts Payable, % | 5.27 | 5.18 | 3.89 | 4.12 | 3.99 | 4.49 | 4.49 | 4.49 | 4.49 | 4.49 |
| Capital Expenditure | -199,876.0 | -150,531.0 | -189,908.0 | -228,626.0 | -182,936.0 | -199,964.3 | -203,851.0 | -207,813.3 | -211,852.5 | -215,970.3 |
| Capital Expenditure, % | -12.26 | -8.31 | -11.26 | -13.94 | -10.49 | -11.25 | -11.25 | -11.25 | -11.25 | -11.25 |
| Tax Rate, % | 23.19 | 23.19 | 23.19 | 23.19 | 23.19 | 23.19 | 23.19 | 23.19 | 23.19 | 23.19 |
| EBITAT | 237,340.7 | 314,349.9 | 244,889.0 | 183,266.5 | 236,022.5 | 253,574.5 | 258,503.2 | 263,527.7 | 268,649.9 | 273,871.7 |
| Depreciation | ||||||||||
| Changes in Account Receivables | ||||||||||
| Changes in Inventories | ||||||||||
| Changes in Accounts Payable | ||||||||||
| Capital Expenditure | ||||||||||
| UFCF | -435,736.3 | 206,485.9 | 174,516.0 | 171,647.5 | 256,926.5 | 186,322.2 | 214,381.9 | 218,548.8 | 222,796.7 | 227,127.2 |
| WACC, % | 7.39 | 7.39 | 7.4 | 7.39 | 7.4 | 7.4 | 7.4 | 7.4 | 7.4 | 7.4 |
| PV UFCF | ||||||||||
| SUM PV UFCF | 862,269.5 | |||||||||
| Long Term Growth Rate, % | 3.00 | |||||||||
| Free cash flow (T + 1) | 233,941 | |||||||||
| Terminal Value | 5,322,729 | |||||||||
| Present Terminal Value | 3,725,730 | |||||||||
| Enterprise Value | 4,587,999 | |||||||||
| Net Debt | -349,071 | |||||||||
| Equity Value | 4,937,070 | |||||||||
| Diluted Shares Outstanding, MM | 1,869 | |||||||||
| Equity Value Per Share | 2,641.62 |
Benefits of Choosing Murata Manufacturing
- Authentic (6981T) Financial Data: Pre-loaded with Murata's historical and forecasted figures for accurate analysis.
- Customizable Template: Easily adjust critical inputs such as revenue growth, WACC, and EBITDA percentages.
- Instant Calculations: Watch Murata's intrinsic value update in real-time as you make changes.
- Expert Valuation Tool: Tailored for investors, analysts, and consultants in search of precise DCF outcomes.
- Intuitive Design: User-friendly layout and straightforward instructions suitable for all skill levels.
Key Features
- Customizable Forecast Inputs: Adjust essential parameters such as revenue growth, EBITDA %, and capital expenditure estimates.
- Instant DCF Valuation: Quickly computes intrinsic value, NPV, and other financial outputs.
- Industry-Leading Precision: Leverages Murata Manufacturing's real-world financial data for accurate valuation results.
- Simplified Scenario Analysis: Effortlessly test various assumptions and compare the resulting outcomes.
- Efficiency Booster: Avoid the complexities of creating valuation models from the ground up.
Process Overview
- Step 1: Download the Excel template for Murata Manufacturing Co., Ltd. (6981T).
- Step 2: Examine the pre-filled financial data and projections for Murata.
- Step 3: Adjust key inputs such as revenue growth, WACC, and tax rates (highlighted cells).
- Step 4: Observe the DCF model refresh in real-time as you modify your assumptions.
- Step 5: Evaluate the results and utilize the findings for your investment analysis.
Why Choose This Calculator for Murata Manufacturing Co., Ltd. (6981T)?
- All-in-One Solution: Features DCF, WACC, and financial ratio analyses bundled in a single tool.
- Flexible Inputs: Modify the yellow-highlighted fields to explore different scenarios.
- In-Depth Analysis: Automatically determines the intrinsic value and Net Present Value for Murata.
- Preloaded Information: Comes with both historical and forecasted data for reliable baseline calculations.
- Expert-Level Design: Perfectly suited for financial analysts, investors, and business consultants.
Who Should Consider Murata Manufacturing Co., Ltd. (6981T)?
- Individual Investors: Gain insights for making informed decisions on buying or selling shares of Murata Manufacturing Co., Ltd. (6981T).
- Financial Analysts: Enhance valuation processes with comprehensive financial models tailored for Murata Manufacturing Co., Ltd. (6981T).
- Consultants: Provide clients with precise and timely valuation assessments related to Murata Manufacturing Co., Ltd. (6981T).
- Business Owners: Learn from the valuation strategies of major companies like Murata Manufacturing Co., Ltd. (6981T) to inform your own business strategies.
- Finance Students: Explore real-world valuation techniques using the data and scenarios surrounding Murata Manufacturing Co., Ltd. (6981T).
Contents of the Template
- Pre-Filled Data: Contains Murata Manufacturing Co., Ltd.’s historical financials and projections.
- Discounted Cash Flow Model: An editable DCF valuation model featuring automatic calculations.
- Weighted Average Cost of Capital (WACC): A specific sheet for computing WACC based on personalized inputs.
- Key Financial Ratios: Evaluate Murata’s profitability, efficiency, and financial leverage.
- Customizable Inputs: Easily modify revenue growth, profit margins, and tax rates.
- Clear Dashboard: Visual representations and tables summarizing vital valuation outcomes.
Disclaimer
All information, articles, and product details provided on this website are for general informational and educational purposes only. We do not claim any ownership over, nor do we intend to infringe upon, any trademarks, copyrights, logos, brand names, or other intellectual property mentioned or depicted on this site. Such intellectual property remains the property of its respective owners, and any references here are made solely for identification or informational purposes, without implying any affiliation, endorsement, or partnership.
We make no representations or warranties, express or implied, regarding the accuracy, completeness, or suitability of any content or products presented. Nothing on this website should be construed as legal, tax, investment, financial, medical, or other professional advice. In addition, no part of this site—including articles or product references—constitutes a solicitation, recommendation, endorsement, advertisement, or offer to buy or sell any securities, franchises, or other financial instruments, particularly in jurisdictions where such activity would be unlawful.
All content is of a general nature and may not address the specific circumstances of any individual or entity. It is not a substitute for professional advice or services. Any actions you take based on the information provided here are strictly at your own risk. You accept full responsibility for any decisions or outcomes arising from your use of this website and agree to release us from any liability in connection with your use of, or reliance upon, the content or products found herein.