
|
ZENKOKU HOSHO Co.,Ltd. (7164.T) DCF Valuation |
Fully Editable: Tailor To Your Needs In Excel Or Sheets
Professional Design: Trusted, Industry-Standard Templates
Investor-Approved Valuation Models
MAC/PC Compatible, Fully Unlocked
No Expertise Is Needed; Easy To Follow
ZENKOKU HOSHO Co.,Ltd. (7164.T) Bundle
Looking to assess the intrinsic value of ZENKOKU HOSHO Co., Ltd.? Our (7164T) DCF Calculator integrates real-world data with comprehensive customization features, enabling you to refine your forecasts and enhance your investment choices.
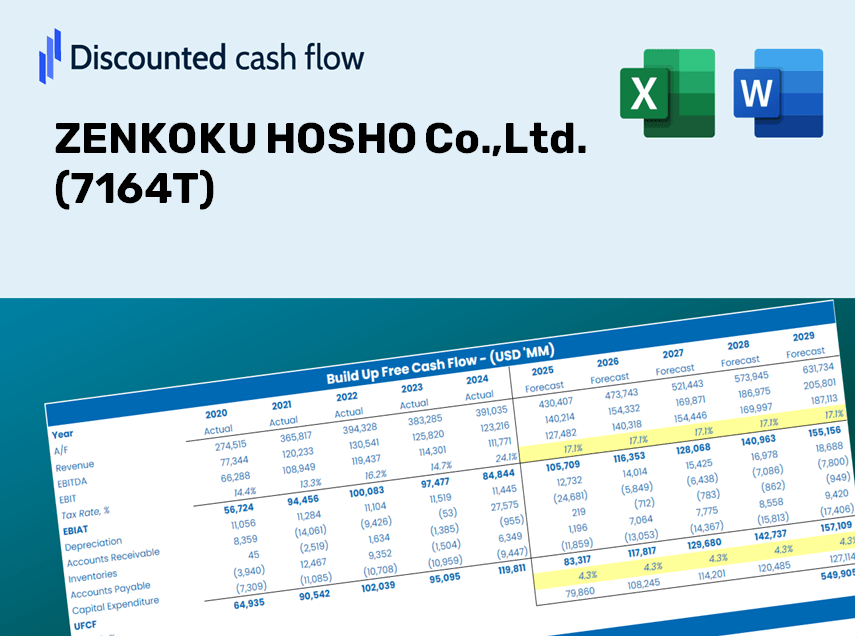
Discounted Cash Flow (DCF) - (USD MM)
| Year | AY1 2021 |
AY2 2022 |
AY3 2023 |
AY4 2024 |
AY5 2025 |
FY1 2026 |
FY2 2027 |
FY3 2028 |
FY4 2029 |
FY5 2030 |
|---|---|---|---|---|---|---|---|---|---|---|
| Revenue | 47,833.0 | 48,841.0 | 50,272.0 | 51,638.0 | 56,972.0 | 59,547.7 | 62,239.9 | 65,053.8 | 67,994.8 | 71,068.9 |
| Revenue Growth, % | 0 | 2.11 | 2.93 | 2.72 | 10.33 | 4.52 | 4.52 | 4.52 | 4.52 | 4.52 |
| EBITDA | 40,122.0 | 41,442.0 | 42,431.0 | 42,584.0 | 47,533.0 | 49,904.8 | 52,161.0 | 54,519.2 | 56,984.0 | 59,560.2 |
| EBITDA, % | 83.88 | 84.85 | 84.4 | 82.47 | 83.43 | 83.81 | 83.81 | 83.81 | 83.81 | 83.81 |
| Depreciation | 351.0 | 379.0 | 359.0 | 383.0 | 926.0 | 546.8 | 571.5 | 597.3 | 624.3 | 652.5 |
| Depreciation, % | 0.7338 | 0.77599 | 0.71412 | 0.7417 | 1.63 | 0.91819 | 0.91819 | 0.91819 | 0.91819 | 0.91819 |
| EBIT | 39,771.0 | 41,063.0 | 42,072.0 | 42,201.0 | 46,607.0 | 49,358.0 | 51,589.5 | 53,921.8 | 56,359.7 | 58,907.7 |
| EBIT, % | 83.15 | 84.07 | 83.69 | 81.72 | 81.81 | 82.89 | 82.89 | 82.89 | 82.89 | 82.89 |
| Total Cash | 187,176.0 | 179,235.0 | 174,186.0 | 140,333.0 | 147,109.0 | 59,547.7 | 62,239.9 | 65,053.8 | 67,994.8 | 71,068.9 |
| Total Cash, percent | .0 | .0 | .0 | .0 | .0 | .0 | .0 | .0 | .0 | .0 |
| Account Receivables | 5,859.0 | 5,671.0 | 6,794.0 | 7,824.0 | 8,929.0 | 8,122.2 | 8,489.4 | 8,873.2 | 9,274.3 | 9,693.6 |
| Account Receivables, % | 12.25 | 11.61 | 13.51 | 15.15 | 15.67 | 13.64 | 13.64 | 13.64 | 13.64 | 13.64 |
| Inventories | .0 | -5,427.0 | -6,794.0 | .0 | .0 | -2,932.8 | -3,065.4 | -3,204.0 | -3,348.9 | -3,500.3 |
| Inventories, % | 0 | -11.11 | -13.51 | 0 | 0 | -4.93 | -4.93 | -4.93 | -4.93 | -4.93 |
| Accounts Payable | .0 | .0 | .0 | .0 | .0 | .0 | .0 | .0 | .0 | .0 |
| Accounts Payable, % | 0 | 0 | 0 | 0 | 0 | 0 | 0 | 0 | 0 | 0 |
| Capital Expenditure | -212.0 | -338.0 | -1,135.0 | -1,983.0 | -86.0 | -879.4 | -919.2 | -960.7 | -1,004.2 | -1,049.6 |
| Capital Expenditure, % | -0.44321 | -0.69204 | -2.26 | -3.84 | -0.15095 | -1.48 | -1.48 | -1.48 | -1.48 | -1.48 |
| Tax Rate, % | 29.86 | 29.86 | 29.86 | 29.86 | 29.86 | 29.86 | 29.86 | 29.86 | 29.86 | 29.86 |
| EBITAT | 27,542.2 | 28,381.0 | 29,131.0 | 29,350.3 | 32,688.0 | 34,283.3 | 35,833.3 | 37,453.3 | 39,146.6 | 40,916.4 |
| Depreciation | ||||||||||
| Changes in Account Receivables | ||||||||||
| Changes in Inventories | ||||||||||
| Changes in Accounts Payable | ||||||||||
| Capital Expenditure | ||||||||||
| UFCF | 21,822.2 | 34,037.0 | 28,599.0 | 19,926.3 | 32,423.0 | 37,690.4 | 35,251.0 | 36,844.7 | 38,510.4 | 40,251.5 |
| WACC, % | 4.96 | 4.96 | 4.96 | 4.96 | 4.96 | 4.96 | 4.96 | 4.96 | 4.96 | 4.96 |
| PV UFCF | ||||||||||
| SUM PV UFCF | 163,099.5 | |||||||||
| Long Term Growth Rate, % | 2.00 | |||||||||
| Free cash flow (T + 1) | 41,057 | |||||||||
| Terminal Value | 1,386,919 | |||||||||
| Present Terminal Value | 1,088,745 | |||||||||
| Enterprise Value | 1,251,845 | |||||||||
| Net Debt | -107,577 | |||||||||
| Equity Value | 1,359,422 | |||||||||
| Diluted Shares Outstanding, MM | 136 | |||||||||
| Equity Value Per Share | 10,020.73 |
Benefits You Will Receive
- Accurate ZENKOKU HOSHO Financials: Access to comprehensive historical and projected data for precise valuation.
- Customizable Parameters: Adjust WACC, tax rates, revenue growth, and capital expenditures as needed.
- Real-Time Calculations: Intrinsic value and NPV are computed automatically.
- Scenario Analysis: Explore various scenarios to assess ZENKOKU HOSHO’s future performance.
- User-Friendly Design: Designed for experts while remaining approachable for newcomers.
Key Features
- Comprehensive DCF Calculator: Features detailed unlevered and levered DCF valuation frameworks tailored for ZENKOKU HOSHO Co., Ltd. (7164T).
- WACC Calculator: Customizable Weighted Average Cost of Capital sheet designed specifically for your financial analysis needs.
- Modifiable Forecast Assumptions: Easily adjust growth rates, capital spending, and discount rates to suit your projections.
- Integrated Financial Ratios: Evaluate profitability, leverage, and efficiency ratios relevant to ZENKOKU HOSHO Co., Ltd. (7164T).
- Interactive Dashboard and Charts: Visual representations that condense critical valuation metrics for straightforward analysis.
How It Functions
- Step 1: Download the Excel spreadsheet.
- Step 2: Examine the pre-filled ZENKOKU HOSHO Co., Ltd. (7164T) data (both historical and forecasted).
- Step 3: Modify key assumptions (highlighted in yellow) according to your evaluation.
- Step 4: Observe the automatic recalculations of ZENKOKU HOSHO's intrinsic value.
- Step 5: Utilize the results for investment analysis or reporting purposes.
Why Select This Calculator for ZENKOKU HOSHO Co., Ltd. (7164T)?
- Precise Financials: Utilize ZENKOKU HOSHO's actual financial data for trustworthy valuation outcomes.
- Customizable Features: Modify essential inputs such as growth rates, WACC, and tax rates to align with your forecasts.
- Efficiency Boost: Ready-made calculations save you the trouble of starting from the ground up.
- Expert-Level Tool: Tailored for investors, analysts, and consulting professionals.
- Easy to Use: User-friendly design and clear, step-by-step guidance make it accessible for everyone.
Who Can Benefit from ZENKOKU HOSHO Co., Ltd. (7164T)?
- Investors: Assess ZENKOKU HOSHO’s valuation before making stock trading decisions.
- CFOs and Financial Analysts: Optimize valuation methods and evaluate financial forecasts.
- Startup Founders: Understand how established companies like ZENKOKU HOSHO are appraised.
- Consultants: Provide comprehensive valuation reports for client projects.
- Students and Educators: Utilize real-time data to learn and instruct on valuation practices.
Contents of the Template
- Historical Data: Features past financial performance and foundational forecasts for ZENKOKU HOSHO Co., Ltd. (7164T).
- DCF and Levered DCF Models: Comprehensive templates for assessing the intrinsic value of ZENKOKU HOSHO Co., Ltd. (7164T).
- WACC Sheet: Pre-configured calculations for Weighted Average Cost of Capital relevant to ZENKOKU HOSHO Co., Ltd. (7164T).
- Editable Inputs: Customize essential drivers such as growth rates, EBITDA percentage, and CAPEX assumptions for ZENKOKU HOSHO Co., Ltd. (7164T).
- Quarterly and Annual Statements: A thorough analysis of the financial statements of ZENKOKU HOSHO Co., Ltd. (7164T).
- Interactive Dashboard: Dynamically visualize valuation outcomes and projections for ZENKOKU HOSHO Co., Ltd. (7164T).
Disclaimer
All information, articles, and product details provided on this website are for general informational and educational purposes only. We do not claim any ownership over, nor do we intend to infringe upon, any trademarks, copyrights, logos, brand names, or other intellectual property mentioned or depicted on this site. Such intellectual property remains the property of its respective owners, and any references here are made solely for identification or informational purposes, without implying any affiliation, endorsement, or partnership.
We make no representations or warranties, express or implied, regarding the accuracy, completeness, or suitability of any content or products presented. Nothing on this website should be construed as legal, tax, investment, financial, medical, or other professional advice. In addition, no part of this site—including articles or product references—constitutes a solicitation, recommendation, endorsement, advertisement, or offer to buy or sell any securities, franchises, or other financial instruments, particularly in jurisdictions where such activity would be unlawful.
All content is of a general nature and may not address the specific circumstances of any individual or entity. It is not a substitute for professional advice or services. Any actions you take based on the information provided here are strictly at your own risk. You accept full responsibility for any decisions or outcomes arising from your use of this website and agree to release us from any liability in connection with your use of, or reliance upon, the content or products found herein.