
|
Tokyo Kiraboshi Financial Group, Inc. (7173.T) DCF Valuation |
Fully Editable: Tailor To Your Needs In Excel Or Sheets
Professional Design: Trusted, Industry-Standard Templates
Investor-Approved Valuation Models
MAC/PC Compatible, Fully Unlocked
No Expertise Is Needed; Easy To Follow
Tokyo Kiraboshi Financial Group, Inc. (7173.T) Bundle
Discover the true value of Tokyo Kiraboshi Financial Group, Inc. (7173T) with our advanced DCF Calculator! Adjust key assumptions, explore various scenarios, and evaluate how changes influence the valuation of Tokyo Kiraboshi Financial Group, Inc. (7173T) – all within one convenient Excel template.
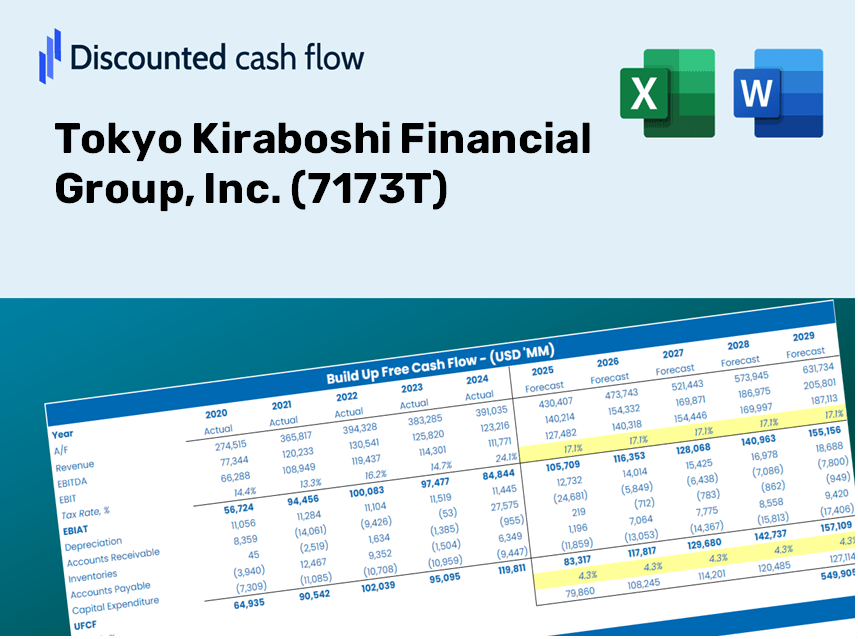
Discounted Cash Flow (DCF) - (USD MM)
| Year | AY1 2020 |
AY2 2021 |
AY3 2022 |
AY4 2023 |
AY5 2024 |
FY1 2025 |
FY2 2026 |
FY3 2027 |
FY4 2028 |
FY5 2029 |
|---|---|---|---|---|---|---|---|---|---|---|
| Revenue | 83,943.0 | 92,037.0 | 121,491.0 | 129,567.0 | 156,723.0 | 183,856.1 | 215,686.6 | 253,028.0 | 296,834.1 | 348,224.3 |
| Revenue Growth, % | 0 | 9.64 | 32 | 6.65 | 20.96 | 17.31 | 17.31 | 17.31 | 17.31 | 17.31 |
| EBITDA | 12,919.0 | 29,883.0 | 37,645.0 | 38,748.0 | 53,617.0 | 52,568.7 | 61,669.8 | 72,346.6 | 84,871.7 | 99,565.4 |
| EBITDA, % | 15.39 | 32.47 | 30.99 | 29.91 | 34.21 | 28.59 | 28.59 | 28.59 | 28.59 | 28.59 |
| Depreciation | 4,820.0 | 5,112.0 | 5,777.0 | 5,999.0 | 7,870.0 | 9,451.3 | 11,087.6 | 13,007.2 | 15,259.1 | 17,900.8 |
| Depreciation, % | 5.74 | 5.55 | 4.76 | 4.63 | 5.02 | 5.14 | 5.14 | 5.14 | 5.14 | 5.14 |
| EBIT | 8,099.0 | 24,771.0 | 31,868.0 | 32,749.0 | 45,747.0 | 43,117.4 | 50,582.2 | 59,339.4 | 69,612.7 | 81,664.6 |
| EBIT, % | 9.65 | 26.91 | 26.23 | 25.28 | 29.19 | 23.45 | 23.45 | 23.45 | 23.45 | 23.45 |
| Total Cash | 753,974.0 | 844,418.0 | 936,273.0 | 1,157,591.0 | 980,840.0 | 183,856.1 | 215,686.6 | 253,028.0 | 296,834.1 | 348,224.3 |
| Total Cash, percent | .0 | .0 | .0 | .0 | .0 | .0 | .0 | .0 | .0 | .0 |
| Account Receivables | .0 | .0 | .0 | .0 | .0 | .0 | .0 | .0 | .0 | .0 |
| Account Receivables, % | 0 | 0 | 0 | 0 | 0 | 0 | 0 | 0 | 0 | 0 |
| Inventories | .0 | .0 | .0 | .0 | .0 | .0 | .0 | .0 | .0 | .0 |
| Inventories, % | 0 | 0 | 0 | 0 | 0 | 0 | 0 | 0 | 0 | 0 |
| Accounts Payable | .0 | .0 | .0 | .0 | .0 | .0 | .0 | .0 | .0 | .0 |
| Accounts Payable, % | 0 | 0 | 0 | 0 | 0 | 0 | 0 | 0 | 0 | 0 |
| Capital Expenditure | -7,434.0 | -7,213.0 | -9,046.0 | -13,510.0 | -6,455.0 | -14,224.8 | -16,687.5 | -19,576.6 | -22,965.9 | -26,941.9 |
| Capital Expenditure, % | -8.86 | -7.84 | -7.45 | -10.43 | -4.12 | -7.74 | -7.74 | -7.74 | -7.74 | -7.74 |
| Tax Rate, % | 31.45 | 31.45 | 31.45 | 31.45 | 31.45 | 31.45 | 31.45 | 31.45 | 31.45 | 31.45 |
| EBITAT | 4,161.0 | 18,183.0 | 21,150.7 | 25,652.0 | 31,361.0 | 29,150.2 | 34,196.9 | 40,117.3 | 47,062.8 | 55,210.6 |
| Depreciation | ||||||||||
| Changes in Account Receivables | ||||||||||
| Changes in Inventories | ||||||||||
| Changes in Accounts Payable | ||||||||||
| Capital Expenditure | ||||||||||
| UFCF | 1,547.0 | 16,082.0 | 17,881.7 | 18,141.0 | 32,776.0 | 24,376.7 | 28,597.0 | 33,547.9 | 39,356.0 | 46,169.6 |
| WACC, % | 3.73 | 4.17 | 4.03 | 4.27 | 4.07 | 4.05 | 4.05 | 4.05 | 4.05 | 4.05 |
| PV UFCF | ||||||||||
| SUM PV UFCF | 151,053.0 | |||||||||
| Long Term Growth Rate, % | 2.00 | |||||||||
| Free cash flow (T + 1) | 47,093 | |||||||||
| Terminal Value | 2,296,278 | |||||||||
| Present Terminal Value | 1,882,767 | |||||||||
| Enterprise Value | 2,033,820 | |||||||||
| Net Debt | -901,514 | |||||||||
| Equity Value | 2,935,334 | |||||||||
| Diluted Shares Outstanding, MM | 43 | |||||||||
| Equity Value Per Share | 67,643.77 |
Your Benefits
- Customizable Forecast Inputs: Easily adjust key assumptions (growth %, margins, WACC) to explore various scenarios.
- Real-World Data: Tokyo Kiraboshi Financial Group, Inc.'s (7173T) financial data pre-loaded to streamline your analysis.
- Automated DCF Outputs: The spreadsheet calculates Net Present Value (NPV) and intrinsic value automatically.
- Sleek and Customizable: A professional Excel model designed to fit your valuation requirements.
- Designed for Analysts and Investors: Perfect for assessing projections, confirming strategies, and enhancing efficiency.
Key Features
- Comprehensive DCF Calculator: Offers in-depth unlevered and levered DCF valuation models tailored for Tokyo Kiraboshi Financial Group, Inc. (7173T).
- WACC Calculator: Ready-to-use Weighted Average Cost of Capital sheet with options for personalized inputs.
- Customizable Forecast Assumptions: Adjust growth rates, capital expenditures, and discount rates as needed.
- Integrated Financial Ratios: Evaluate profitability, leverage, and efficiency ratios specific to Tokyo Kiraboshi Financial Group, Inc. (7173T).
- Interactive Dashboard and Charts: Visual representations to summarize essential valuation metrics for streamlined analysis.
How It Works
- Step 1: Download the prebuilt Excel template featuring Tokyo Kiraboshi Financial Group, Inc.'s (7173T) data.
- Step 2: Navigate through the pre-filled worksheets to familiarize yourself with the essential metrics.
- Step 3: Modify forecasts and assumptions in the editable yellow cells (WACC, growth, margins).
- Step 4: Instantly see the recalculated results, including the intrinsic value of Tokyo Kiraboshi Financial Group, Inc. (7173T).
- Step 5: Utilize the outputs to make informed investment decisions or create detailed reports.
Why Opt for This Calculator?
- Time-Efficient: Eliminate the hassle of building a DCF model from the ground up – it's fully prepared for immediate use.
- Enhanced Accuracy: Dependable financial information and calculations minimize valuation errors.
- Completely Customizable: Adjust the model to align with your specific assumptions and forecasts.
- User-Friendly: Intuitive charts and outputs simplify the analysis of results.
- Endorsed by Industry Experts: Crafted for professionals who prioritize both precision and functionality.
Who Can Benefit from This Product?
- Investors: Accurately assess the fair value of Tokyo Kiraboshi Financial Group, Inc. (7173T) before making investment choices.
- CFOs: Utilize a high-level DCF model for comprehensive financial reporting and analysis.
- Consultants: Effortlessly customize the template for client valuation reports.
- Entrepreneurs: Acquire valuable insights into financial modeling practices of top-tier firms.
- Educators: Employ it as an educational resource to illustrate various valuation techniques.
Overview of the Template Contents
- Preloaded TKFG Data: Historical and projected financial data, including revenue, EBIT, and capital expenditures.
- DCF and WACC Models: Professional-grade spreadsheets for determining intrinsic value and Weighted Average Cost of Capital.
- Editable Inputs: Yellow-highlighted cells for modifying revenue growth, tax rates, and discount rates.
- Financial Statements: Detailed annual and quarterly financials for in-depth analysis.
- Key Ratios: Metrics on profitability, leverage, and efficiency to assess performance.
- Dashboard and Charts: Visual representations of valuation results and underlying assumptions.
Disclaimer
All information, articles, and product details provided on this website are for general informational and educational purposes only. We do not claim any ownership over, nor do we intend to infringe upon, any trademarks, copyrights, logos, brand names, or other intellectual property mentioned or depicted on this site. Such intellectual property remains the property of its respective owners, and any references here are made solely for identification or informational purposes, without implying any affiliation, endorsement, or partnership.
We make no representations or warranties, express or implied, regarding the accuracy, completeness, or suitability of any content or products presented. Nothing on this website should be construed as legal, tax, investment, financial, medical, or other professional advice. In addition, no part of this site—including articles or product references—constitutes a solicitation, recommendation, endorsement, advertisement, or offer to buy or sell any securities, franchises, or other financial instruments, particularly in jurisdictions where such activity would be unlawful.
All content is of a general nature and may not address the specific circumstances of any individual or entity. It is not a substitute for professional advice or services. Any actions you take based on the information provided here are strictly at your own risk. You accept full responsibility for any decisions or outcomes arising from your use of this website and agree to release us from any liability in connection with your use of, or reliance upon, the content or products found herein.