
|
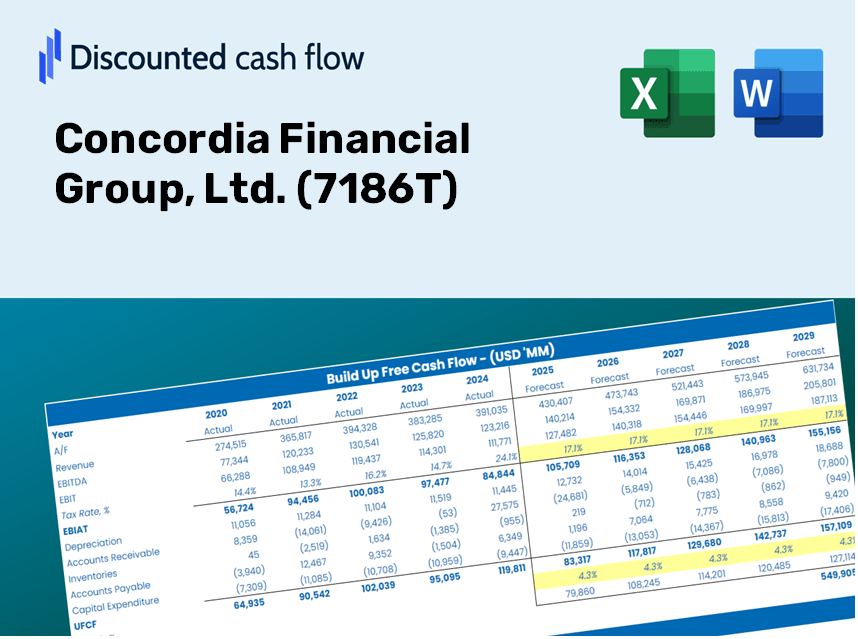
Concordia Financial Group, Ltd. (7186.T) DCF Valuation |
Fully Editable: Tailor To Your Needs In Excel Or Sheets
Professional Design: Trusted, Industry-Standard Templates
Investor-Approved Valuation Models
MAC/PC Compatible, Fully Unlocked
No Expertise Is Needed; Easy To Follow
Concordia Financial Group, Ltd. (7186.T) Bundle
Take charge of your Concordia Financial Group, Ltd. (7186T) valuation analysis with our advanced DCF Calculator! Preloaded with authentic (7186T) data, this Excel template enables you to adjust forecasts and assumptions to accurately calculate the intrinsic value of Concordia Financial Group, Ltd.
Discounted Cash Flow (DCF) - (USD MM)
| Year | AY1 2021 |
AY2 2022 |
AY3 2023 |
AY4 2024 |
AY5 2025 |
FY1 2026 |
FY2 2027 |
FY3 2028 |
FY4 2029 |
FY5 2030 |
|---|---|---|---|---|---|---|---|---|---|---|
| Revenue | 268,887.0 | 270,296.0 | 296,107.0 | 340,710.0 | 320,944.0 | 336,457.5 | 352,721.0 | 369,770.5 | 387,644.2 | 406,381.9 |
| Revenue Growth, % | 0 | 0.52401 | 9.55 | 15.06 | -5.8 | 4.83 | 4.83 | 4.83 | 4.83 | 4.83 |
| EBITDA | 44,012.0 | 92,308.0 | 93,683.0 | 104,661.0 | 131,692.0 | 103,567.3 | 108,573.4 | 113,821.5 | 119,323.4 | 125,091.1 |
| EBITDA, % | 16.37 | 34.15 | 31.64 | 30.72 | 41.03 | 30.78 | 30.78 | 30.78 | 30.78 | 30.78 |
| Depreciation | .0 | 13,724.0 | 13,152.0 | 13,268.0 | 12,774.0 | 11,704.3 | 12,270.0 | 12,863.1 | 13,484.9 | 14,136.7 |
| Depreciation, % | 0 | 5.08 | 4.44 | 3.89 | 3.98 | 3.48 | 3.48 | 3.48 | 3.48 | 3.48 |
| EBIT | 44,012.0 | 78,584.0 | 80,531.0 | 91,393.0 | 118,918.0 | 91,863.0 | 96,303.4 | 100,958.4 | 105,838.5 | 110,954.4 |
| EBIT, % | 16.37 | 29.07 | 27.2 | 26.82 | 37.05 | 27.3 | 27.3 | 27.3 | 27.3 | 27.3 |
| Total Cash | 4,173,809.0 | 5,637,213.0 | 6,426,095.0 | 4,133,789.0 | 4,445,659.0 | 336,457.5 | 352,721.0 | 369,770.5 | 387,644.2 | 406,381.9 |
| Total Cash, percent | .0 | .0 | .0 | .0 | .0 | .0 | .0 | .0 | .0 | .0 |
| Account Receivables | .0 | .0 | .0 | .0 | .0 | .0 | .0 | .0 | .0 | .0 |
| Account Receivables, % | 0 | 0 | 0 | 0 | 0 | 0 | 0 | 0 | 0 | 0 |
| Inventories | .0 | .0 | .0 | .0 | .0 | .0 | .0 | .0 | .0 | .0 |
| Inventories, % | 0 | 0 | 0 | 0 | 0 | 0 | 0 | 0 | 0 | 0 |
| Accounts Payable | .0 | .0 | .0 | .0 | .0 | .0 | .0 | .0 | .0 | .0 |
| Accounts Payable, % | 0 | 0 | 0 | 0 | 0 | 0 | 0 | 0 | 0 | 0 |
| Capital Expenditure | -15,501.0 | -17,263.0 | -12,289.0 | -9,353.0 | -10,175.0 | -14,950.3 | -15,673.0 | -16,430.6 | -17,224.8 | -18,057.4 |
| Capital Expenditure, % | -5.76 | -6.39 | -4.15 | -2.75 | -3.17 | -4.44 | -4.44 | -4.44 | -4.44 | -4.44 |
| Tax Rate, % | 30.37 | 30.37 | 30.37 | 30.37 | 30.37 | 30.37 | 30.37 | 30.37 | 30.37 | 30.37 |
| EBITAT | 30,693.9 | 53,881.0 | 56,157.6 | 66,931.7 | 82,805.7 | 64,470.6 | 67,587.0 | 70,853.9 | 74,278.8 | 77,869.2 |
| Depreciation | ||||||||||
| Changes in Account Receivables | ||||||||||
| Changes in Inventories | ||||||||||
| Changes in Accounts Payable | ||||||||||
| Capital Expenditure | ||||||||||
| UFCF | 15,192.9 | 50,342.0 | 57,020.6 | 70,846.7 | 85,404.7 | 61,224.6 | 64,184.0 | 67,286.5 | 70,538.9 | 73,948.6 |
| WACC, % | 3.58 | 3.55 | 3.58 | 3.66 | 3.58 | 3.59 | 3.59 | 3.59 | 3.59 | 3.59 |
| PV UFCF | ||||||||||
| SUM PV UFCF | 302,696.3 | |||||||||
| Long Term Growth Rate, % | 2.00 | |||||||||
| Free cash flow (T + 1) | 75,428 | |||||||||
| Terminal Value | 4,744,097 | |||||||||
| Present Terminal Value | 3,977,095 | |||||||||
| Enterprise Value | 4,279,791 | |||||||||
| Net Debt | -2,204,665 | |||||||||
| Equity Value | 6,484,456 | |||||||||
| Diluted Shares Outstanding, MM | 1,156 | |||||||||
| Equity Value Per Share | 5,609.34 |
What You Will Receive
- Authentic 7186T Financial Data: Access to historical and projected figures for precise valuation.
- Customizable Variables: Adjust WACC, tax rates, revenue growth, and capital expenditures to fit your analysis.
- Automatic Calculations: Dynamic calculations for intrinsic value and NPV.
- Scenario Analysis: Explore multiple scenarios to assess Concordia Financial Group’s future performance.
- User-Friendly Design: Designed for professionals while remaining approachable for newcomers.
Key Features
- Comprehensive DCF Calculator: Provides detailed unlevered and levered DCF valuation models tailored for Concordia Financial Group, Ltd. (7186T).
- WACC Calculator: Pre-designed Weighted Average Cost of Capital sheet with user-friendly inputs for customization.
- Customizable Forecast Assumptions: Adjust growth rates, capital expenditures, and discount rates as needed.
- Integrated Financial Ratios: Evaluate profitability, leverage, and efficiency ratios for Concordia Financial Group, Ltd. (7186T).
- Interactive Dashboard and Charts: Visual representations that summarize crucial valuation metrics for straightforward analysis.
How It Functions
- Download: Obtain the comprehensive Excel file featuring Concordia Financial Group, Ltd.'s (7186T) financial data.
- Customize: Modify forecasts, including revenue growth, EBITDA percentage, and WACC.
- Update Automatically: Intrinsic value and NPV calculations refresh in real-time.
- Test Scenarios: Generate various projections and quickly compare the results.
- Make Decisions: Utilize the valuation outputs to inform your investment approach.
Why Choose Concordia Financial Group's Calculator?
- All-in-One Solution: Features DCF, WACC, and financial ratio analyses seamlessly integrated.
- Adjustable Parameters: Modify the highlighted cells to explore different financial scenarios.
- In-Depth Analysis: Automatically computes the intrinsic value and Net Present Value for Concordia Financial Group (7186T).
- Preloaded Information: Access to historical and projected data for reliable baseline measurements.
- High-Quality Standards: Tailored for financial professionals, investors, and business advisors.
Who Can Benefit from Concordia Financial Group, Ltd. (7186T)?
- Investors: Assess Concordia’s valuation to inform buying or selling decisions.
- CFOs and Financial Analysts: Optimize valuation workflows and evaluate financial forecasts.
- Startup Founders: Discover valuation methodologies used for assessing companies like Concordia.
- Consultants: Produce detailed valuation reports for your clients featuring Concordia.
- Students and Educators: Utilize real data from Concordia to enhance skills in valuation analysis.
Contents of the Template
- Comprehensive DCF Model: An editable template featuring detailed valuation calculations tailored for Concordia Financial Group, Ltd. (7186T).
- Real-World Data: Preloaded historical and projected financials for Concordia Financial Group, Ltd. (7186T) to facilitate analysis.
- Customizable Parameters: Modify WACC, growth rates, and tax assumptions to explore various scenarios.
- Financial Statements: Complete annual and quarterly breakdowns for enhanced insights into financial performance.
- Key Ratios: Integrated analysis for profitability, efficiency, and leverage metrics specific to Concordia Financial Group, Ltd. (7186T).
- Dashboard with Visual Outputs: Displays charts and tables for clear, actionable insights.
Disclaimer
All information, articles, and product details provided on this website are for general informational and educational purposes only. We do not claim any ownership over, nor do we intend to infringe upon, any trademarks, copyrights, logos, brand names, or other intellectual property mentioned or depicted on this site. Such intellectual property remains the property of its respective owners, and any references here are made solely for identification or informational purposes, without implying any affiliation, endorsement, or partnership.
We make no representations or warranties, express or implied, regarding the accuracy, completeness, or suitability of any content or products presented. Nothing on this website should be construed as legal, tax, investment, financial, medical, or other professional advice. In addition, no part of this site—including articles or product references—constitutes a solicitation, recommendation, endorsement, advertisement, or offer to buy or sell any securities, franchises, or other financial instruments, particularly in jurisdictions where such activity would be unlawful.
All content is of a general nature and may not address the specific circumstances of any individual or entity. It is not a substitute for professional advice or services. Any actions you take based on the information provided here are strictly at your own risk. You accept full responsibility for any decisions or outcomes arising from your use of this website and agree to release us from any liability in connection with your use of, or reliance upon, the content or products found herein.