
|
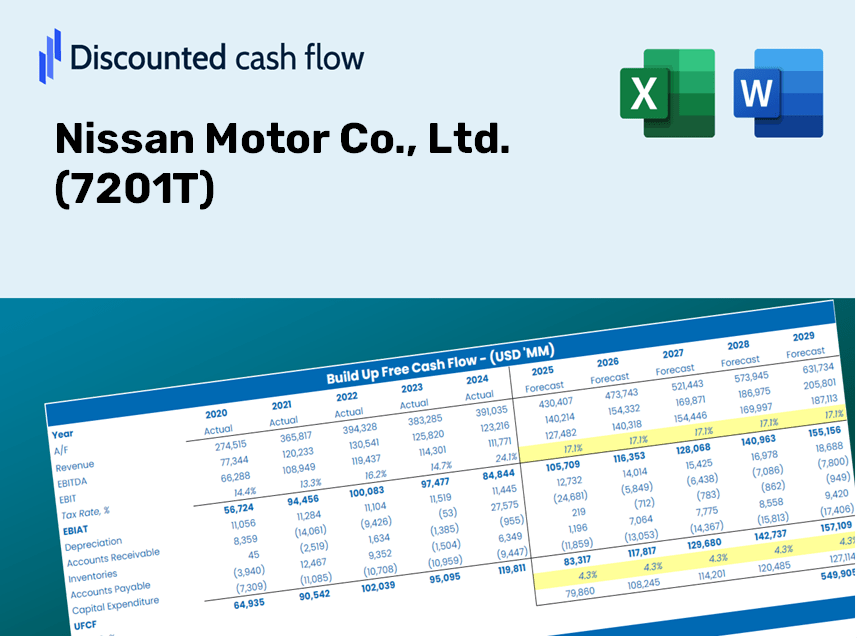
Nissan Motor Co., Ltd. (7201.T) DCF Valuation |
Fully Editable: Tailor To Your Needs In Excel Or Sheets
Professional Design: Trusted, Industry-Standard Templates
Investor-Approved Valuation Models
MAC/PC Compatible, Fully Unlocked
No Expertise Is Needed; Easy To Follow
Nissan Motor Co., Ltd. (7201.T) Bundle
Discover the true value of Nissan Motor Co., Ltd. (7201T) with our advanced DCF Calculator! Adjust essential assumptions, explore various scenarios, and assess the effects of changes on Nissan's valuation – all conveniently within a single Excel template.
Discounted Cash Flow (DCF) - (USD MM)
| Year | AY1 2021 |
AY2 2022 |
AY3 2023 |
AY4 2024 |
AY5 2025 |
FY1 2026 |
FY2 2027 |
FY3 2028 |
FY4 2029 |
FY5 2030 |
|---|---|---|---|---|---|---|---|---|---|---|
| Revenue | 7,862,572.0 | 8,424,585.0 | 10,596,695.0 | 12,685,716.0 | 12,633,214.0 | 14,282,826.5 | 16,147,841.2 | 18,256,384.7 | 20,640,256.4 | 23,335,408.0 |
| Revenue Growth, % | 0 | 7.15 | 25.78 | 19.71 | -0.41387 | 13.06 | 13.06 | 13.06 | 13.06 | 13.06 |
| EBITDA | 406,913.0 | 1,130,184.0 | 1,160,541.0 | 1,356,452.0 | 360,762.0 | 1,230,921.2 | 1,391,651.7 | 1,573,370.0 | 1,778,816.6 | 2,011,089.9 |
| EBITDA, % | 5.18 | 13.42 | 10.95 | 10.69 | 2.86 | 8.62 | 8.62 | 8.62 | 8.62 | 8.62 |
| Depreciation | 709,764.0 | 690,025.0 | 695,060.0 | 679,195.0 | 697,011.0 | 989,749.9 | 1,118,988.9 | 1,265,103.6 | 1,430,297.6 | 1,617,062.2 |
| Depreciation, % | 9.03 | 8.19 | 6.56 | 5.35 | 5.52 | 6.93 | 6.93 | 6.93 | 6.93 | 6.93 |
| EBIT | -302,851.0 | 440,159.0 | 465,481.0 | 677,257.0 | -336,249.0 | 241,171.3 | 272,662.8 | 308,266.4 | 348,519.0 | 394,027.7 |
| EBIT, % | -3.85 | 5.22 | 4.39 | 5.34 | -2.66 | 1.69 | 1.69 | 1.69 | 1.69 | 1.69 |
| Total Cash | 2,034,026.0 | 1,792,692.0 | 2,014,387.0 | 2,132,146.0 | 2,197,513.0 | 2,866,871.2 | 3,241,219.8 | 3,664,450.0 | 4,142,944.4 | 4,683,919.4 |
| Total Cash, percent | .0 | .0 | .0 | .0 | .0 | .0 | .0 | .0 | .0 | .0 |
| Account Receivables | 6,551,715.0 | 6,538,468.0 | 6,920,019.0 | 7,899,344.0 | 7,670,603.0 | 9,975,998.4 | 11,278,638.6 | 12,751,374.2 | 14,416,415.8 | 16,298,874.2 |
| Account Receivables, % | 83.33 | 77.61 | 65.3 | 62.27 | 60.72 | 69.85 | 69.85 | 69.85 | 69.85 | 69.85 |
| Inventories | 1,139,571.0 | 1,364,481.0 | 1,703,176.0 | 2,055,605.0 | 1,672,305.0 | 2,176,822.8 | 2,461,066.7 | 2,782,426.5 | 3,145,748.6 | 3,556,512.3 |
| Inventories, % | 14.49 | 16.2 | 16.07 | 16.2 | 13.24 | 15.24 | 15.24 | 15.24 | 15.24 | 15.24 |
| Accounts Payable | 1,464,400.0 | 1,357,576.0 | 1,865,525.0 | 2,229,210.0 | 2,070,387.0 | 2,465,365.2 | 2,787,286.2 | 3,151,242.9 | 3,562,724.0 | 4,027,935.4 |
| Accounts Payable, % | 18.62 | 16.11 | 17.6 | 17.57 | 16.39 | 17.26 | 17.26 | 17.26 | 17.26 | 17.26 |
| Capital Expenditure | -1,182,305.0 | -1,123,886.0 | -1,133,502.0 | -1,627,778.0 | -1,911,741.0 | -1,915,003.3 | -2,165,059.5 | -2,447,767.4 | -2,767,390.6 | -3,128,749.3 |
| Capital Expenditure, % | -15.04 | -13.34 | -10.7 | -12.83 | -15.13 | -13.41 | -13.41 | -13.41 | -13.41 | -13.41 |
| Tax Rate, % | -62.2 | -62.2 | -62.2 | -62.2 | -62.2 | -62.2 | -62.2 | -62.2 | -62.2 | -62.2 |
| EBITAT | -400,456.0 | 246,919.1 | 256,662.5 | 482,207.9 | -545,403.7 | 184,465.6 | 208,552.7 | 235,785.0 | 266,573.2 | 301,381.6 |
| Depreciation | ||||||||||
| Changes in Account Receivables | ||||||||||
| Changes in Inventories | ||||||||||
| Changes in Accounts Payable | ||||||||||
| Capital Expenditure | ||||||||||
| UFCF | -7,099,883.0 | -505,428.9 | -394,076.5 | -1,434,444.1 | -1,306,915.7 | -3,155,722.8 | -2,102,480.9 | -2,377,017.5 | -2,687,402.3 | -3,038,316.4 |
| WACC, % | 4.65 | 3.29 | 3.26 | 3.76 | 4.65 | 3.92 | 3.92 | 3.92 | 3.92 | 3.92 |
| PV UFCF | ||||||||||
| SUM PV UFCF | -11,912,712.7 | |||||||||
| Long Term Growth Rate, % | 3.30 | |||||||||
| Free cash flow (T + 1) | -3,138,581 | |||||||||
| Terminal Value | -506,081,832 | |||||||||
| Present Terminal Value | -417,562,462 | |||||||||
| Enterprise Value | -429,475,175 | |||||||||
| Net Debt | 6,138,348 | |||||||||
| Equity Value | -435,613,523 | |||||||||
| Diluted Shares Outstanding, MM | 3,586 | |||||||||
| Equity Value Per Share | -121,467.86 |
What You Will Receive
- Pre-Filled Financial Model: Nissan's actual data facilitates accurate DCF valuation.
- Complete Forecast Management: Modify revenue growth, profit margins, WACC, and other essential drivers.
- Real-Time Calculations: Automatic updates provide immediate feedback as you adjust inputs.
- Investor-Ready Template: A polished Excel file crafted for high-quality valuation presentations.
- Customizable and Reusable: Designed for versatility, allowing repeated application for in-depth forecasts.
Key Features
- Comprehensive Historical Data: Access Nissan's financial statements and detailed forecasts.
- Customizable Parameters: Adjust WACC, tax rates, revenue growth, and EBITDA margins as needed.
- Real-Time Insights: Watch Nissan's intrinsic value update instantly.
- Intuitive Visualizations: Clear dashboard charts showcase valuation results and essential metrics.
- Designed for Precision: A reliable resource for analysts, investors, and finance professionals.
How It Works
- Step 1: Download the prebuilt Excel template featuring Nissan Motor Co., Ltd.'s (7201T) data.
- Step 2: Review the pre-filled sheets to familiarize yourself with the key metrics.
- Step 3: Modify forecasts and assumptions in the editable yellow cells (WACC, growth, margins).
- Step 4: Instantly access recalculated results, including Nissan Motor Co., Ltd.'s (7201T) intrinsic value.
- Step 5: Use the outputs to make informed investment decisions or create comprehensive reports.
Why Choose This Calculator for Nissan Motor Co., Ltd. (7201T)?
- Accurate Data: Up-to-date Nissan financials provide dependable valuation outcomes.
- Customizable: Tailor key metrics such as growth rates, WACC, and tax rates to fit your specific forecasts.
- Time-Saving: Preconfigured calculations save you the hassle of starting from the beginning.
- Professional-Grade Tool: Crafted for investors, analysts, and consultants in the automotive sector.
- User-Friendly: Simple layout and guided instructions make it accessible for all users.
Who Can Benefit from This Product?
- Individual Investors: Make informed choices about purchasing or selling Nissan stock (7201T).
- Financial Analysts: Enhance valuation procedures with accessible financial models specific to Nissan.
- Consultants: Provide clients with professional valuation insights regarding Nissan quickly and accurately.
- Business Owners: Gain an understanding of how major corporations like Nissan are valued to inform your own business strategies.
- Finance Students: Acquire valuation skills using real-world data and case studies related to Nissan.
Contents of the Template
- Pre-Filled Data: Features Nissan's historical financial performance and projections.
- Discounted Cash Flow Model: An interactive DCF valuation model with automatic computations.
- Weighted Average Cost of Capital (WACC): A specialized sheet for WACC calculations using customized inputs.
- Key Financial Ratios: Evaluate Nissan's profitability, efficiency, and financial leverage.
- Customizable Inputs: Easily adjust parameters like revenue growth, margins, and tax rates.
- Clear Dashboard: Visualizations and tables that summarize essential valuation outcomes.
Disclaimer
All information, articles, and product details provided on this website are for general informational and educational purposes only. We do not claim any ownership over, nor do we intend to infringe upon, any trademarks, copyrights, logos, brand names, or other intellectual property mentioned or depicted on this site. Such intellectual property remains the property of its respective owners, and any references here are made solely for identification or informational purposes, without implying any affiliation, endorsement, or partnership.
We make no representations or warranties, express or implied, regarding the accuracy, completeness, or suitability of any content or products presented. Nothing on this website should be construed as legal, tax, investment, financial, medical, or other professional advice. In addition, no part of this site—including articles or product references—constitutes a solicitation, recommendation, endorsement, advertisement, or offer to buy or sell any securities, franchises, or other financial instruments, particularly in jurisdictions where such activity would be unlawful.
All content is of a general nature and may not address the specific circumstances of any individual or entity. It is not a substitute for professional advice or services. Any actions you take based on the information provided here are strictly at your own risk. You accept full responsibility for any decisions or outcomes arising from your use of this website and agree to release us from any liability in connection with your use of, or reliance upon, the content or products found herein.