
|
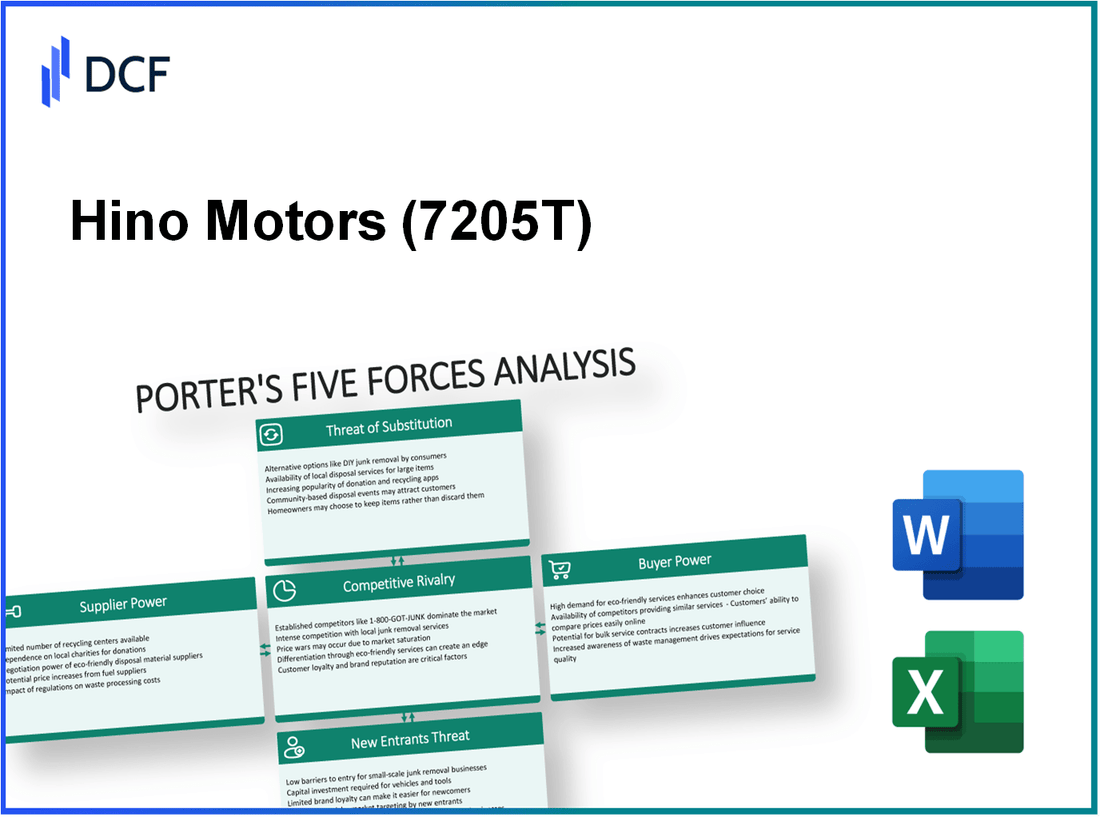
Hino Motors, Ltd. (7205.T): Porter's 5 Forces Analysis |
Fully Editable: Tailor To Your Needs In Excel Or Sheets
Professional Design: Trusted, Industry-Standard Templates
Investor-Approved Valuation Models
MAC/PC Compatible, Fully Unlocked
No Expertise Is Needed; Easy To Follow
Hino Motors, Ltd. (7205.T) Bundle
In the fiercely competitive landscape of the automotive industry, Hino Motors, Ltd. navigates a complex web of market dynamics that shape its strategic positioning. Understanding the implications of Michael Porter’s Five Forces—bargaining power of suppliers and customers, competitive rivalry, threat of substitutes, and threat of new entrants—reveals critical insights into Hino's business challenges and opportunities. Dive deeper to uncover how these forces influence Hino Motors’ operations and market success.
Hino Motors, Ltd. - Porter's Five Forces: Bargaining power of suppliers
The bargaining power of suppliers for Hino Motors, Ltd. can significantly impact its operational costs and overall profitability. This power is influenced by several factors, including the number of suppliers for specialized auto parts, switching costs, supplier relationships, and concentration levels within the supply base.
Limited Number of Suppliers for Specialized Auto Parts
Hino Motors relies on a limited number of suppliers for critical components, particularly in areas like engine systems and transmission components. For instance, as of fiscal year 2022, Hino’s procurement activities were focused on approximately 1,000 suppliers worldwide, with around 50 identified as key suppliers for specialized parts. This concentration of suppliers allows them to exert higher influence over pricing and terms.
High Switching Costs for Alternative Suppliers
Switching suppliers in the automotive industry often entails substantial costs. According to industry analyses, these costs can include not only financial expenditures but also lost production time and the need for additional testing and certification of new suppliers’ products. Estimates indicate that switching costs for auto manufacturers can range from 5% to 15% of annual procurement expenses, depending on the complexity of parts.
Importance of Supplier Relationships for Quality Assurance
Strong relationships with suppliers are essential for Hino Motors to ensure quality assurance and innovation in components. In a recent supplier evaluation report, Hino ranked its suppliers based on quality metrics, with approximately 80% of their key suppliers receiving quality ratings above 90%. This close collaboration often leads to long-term contracts that favor existing supplier relationships, further solidifying their power.
Supplier Concentration Affects Negotiation Leverage
The concentration of suppliers within the automotive sector affects Hino’s negotiating power. For Hino Motors, a large portion of its supply chain is concentrated among a few major players. For example, major suppliers like Denso Corporation and Aisin Seiki account for nearly 30% of Hino's total supply chain expenditures. This concentration allows these suppliers to raise prices with less resistance from Hino, as changing suppliers may not be feasible due to compatibility and performance considerations.
| Factor | Details | Impact on Bargaining Power |
|---|---|---|
| Number of Suppliers | 1,000 worldwide, 50 key suppliers | High |
| Switching Costs | Range from 5% to 15% of annual procurement | High |
| Quality Ratings | 80% of key suppliers rated above 90% | Increases dependency |
| Supplier Concentration | Major suppliers account for 30% of expenditures | High |
Hino Motors, Ltd. - Porter's Five Forces: Bargaining power of customers
The bargaining power of customers for Hino Motors, Ltd. is influenced by several factors. One significant factor is the presence of large-scale buyers, such as fleet operators. These buyers often place substantial pressure on pricing and negotiations.
For instance, in 2022, Hino Motors reported that approximately 70% of its sales came from fleet operators, who demand competitive pricing and robust service contracts. This concentration of sales grants these buyers considerable leverage in negotiations, potentially impacting Hino's margins.
Additionally, there is an increasing demand for fuel-efficient and eco-friendly vehicles. As countries tighten emissions regulations, customers are more inclined to favor companies that can provide greener alternatives. In 2023, the global market for fuel-efficient trucks was estimated at $100 billion, with a projected CAGR of 5.3% from 2023 to 2030. Hino’s commitment to sustainability is reflected in its plan to have 80% of its vehicle lineup powered by hybrid or electric energy by 2025.
Furthermore, the availability of information significantly enhances customer power. With easy access to online resources and reviews, consumers can readily compare vehicles and prices. A recent survey highlighted that 85% of fleet managers utilize digital platforms for research before making purchasing decisions. This access allows them to leverage their findings in negotiations with Hino, resulting in more competitive pricing and offerings.
Price sensitivity among buyers is heightened by the presence of competitive alternatives in the market. Hino operates in a highly competitive sector, with key players such as Isuzu and Mitsubishi Fuso offering similar products. As of 2023, the average price of a conventional truck model is around $50,000, while alternative models from competitors can range from $45,000 to $55,000. This price range makes it crucial for Hino to remain competitive, as a slight price increase can prompt buyers to consider alternatives.
| Metric | Value |
|---|---|
| Percentage of sales from fleet operators (2022) | 70% |
| Global market size for fuel-efficient trucks (2023) | $100 billion |
| CAGR of fuel-efficient trucks market (2023-2030) | 5.3% |
| Percentage of lineup planned to be hybrid/electric by 2025 | 80% |
| Percentage of fleet managers using digital platforms for research | 85% |
| Average conventional truck price (2023) | $50,000 |
| Price range of competitor models | $45,000 - $55,000 |
In conclusion, the bargaining power of customers in the context of Hino Motors, Ltd. is substantial, driven by the influence of large-scale buyers, rising demand for sustainable solutions, increased access to information, and significant price sensitivity in a competitive landscape.
Hino Motors, Ltd. - Porter's Five Forces: Competitive rivalry
Hino Motors, Ltd. operates in a highly competitive environment characterized by numerous competitors within the commercial vehicle manufacturing sector. The intensity of competition among these firms significantly impacts pricing, market share, and overall strategic direction.
Within this sector, Hino faces intense competition from other commercial vehicle manufacturers, including industry giants such as Volvo, Daimler AG, Isuzu Motors Ltd., and MAN SE. For instance, in 2022, the global commercial vehicle market was valued at approximately $191 billion and is projected to grow at a compound annual growth rate (CAGR) of 6.0% from 2023 to 2030.
The market presence of large global players adds pressure on Hino Motors. For example, Volvo Group reported revenues of $51.1 billion in 2022, while Daimler's Truck division achieved revenues of $52.5 billion in the same year. These robust financial performances reflect the significant resources and capabilities that competitors bring to the market.
Product differentiation within the commercial vehicle sector is relatively limited, which intensifies price competition. This lack of differentiation leads to a situation where companies compete primarily on price, forcing Hino to invest in cost efficiencies and innovative solutions to maintain its market position. According to industry analysis, the average profit margin for commercial vehicle manufacturers is around 5%, which further complicates the competitive landscape.
High fixed costs associated with manufacturing and R&D in this industry drive firms like Hino to maintain their market share aggressively. For instance, Hino operates manufacturing plants in Japan, Indonesia, and the Philippines, with a reported capacity to produce approximately 200,000 units annually. This scale increases overhead costs, necessitating constant sales to cover these expenses.
| Company | 2022 Revenue (in billions) | Market Share (%) | Annual Production Capacity (units) |
|---|---|---|---|
| Hino Motors, Ltd. | 17.0 | 5.4 | 200,000 |
| Volvo Group | 51.1 | 15.0 | 280,000 |
| Daimler AG | 52.5 | 14.8 | 350,000 |
| Isuzu Motors Ltd. | 16.5 | 4.9 | 180,000 |
| MAN SE | 12.2 | 3.6 | 150,000 |
The competitive rivalry in the commercial vehicle sector, particularly for Hino Motors, is defined by formidable competition, limited product differentiation, and the necessity to manage high fixed costs effectively. These factors create an environment where Hino must continuously innovate and optimize its operations to remain competitive.
Hino Motors, Ltd. - Porter's Five Forces: Threat of substitutes
The threat of substitutes for Hino Motors is significant, influenced by various factors in the transportation sector. As alternatives become more viable, consumers may shift their preferences, impacting Hino's market position.
Public transportation and logistics services as alternatives
Public transportation and logistics services have seen increased usage due to urbanization and rising fuel prices. In 2022, the global public transportation market was valued at approximately $202 billion and is projected to grow at a CAGR of 3.5% from 2023 to 2030. This growth presents a viable alternative to personal vehicle ownership, thereby affecting demand for Hino’s trucks and other commercial vehicles.
Technological advancements in electric vehicles
The shift towards electric vehicles (EVs) is gaining momentum, with the global electric truck market expected to reach $57.4 billion by 2027, growing at a CAGR of 22.3% from 2020. Hino Motors is investing in electric technology, but competition from established players like Tesla and emerging brands poses a significant threat. For instance, Tesla's electric truck, the Tesla Semi, has garnered over $200 million in pre-orders alone.
Increasing focus on ride-sharing and carpooling reduces demand
Ride-sharing services like Uber and Lyft are reshaping consumer behavior. As of 2023, Uber reported a revenue of $31.88 billion, emphasizing the shift in preference from private car ownership to shared mobility solutions. This trend directly impacts Hino’s target market for commercial vehicles, with fewer consumers opting to purchase trucks or vans intended for individual transport.
Legislative push for green transport solutions
Global initiatives aimed at reducing carbon emissions are propelling the demand for greener transportation alternatives. In 2021, the European Parliament voted to cut greenhouse gas emissions from transportation by 55% by 2030. Such regulations compel logistics companies to adopt more sustainable solutions, pushing Hino to adapt or face declining sales in traditional diesel trucks. For context, as of 2022, about 37% of new vehicles sold in Norway were fully electric, indicating a strong market preference shift.
| Factor | Current Value | Projected Growth |
|---|---|---|
| Global public transportation market | $202 billion (2022) | CAGR 3.5% (2023-2030) |
| Global electric truck market | $57.4 billion (2027) | CAGR 22.3% (2020-2027) |
| Uber's revenue (2023) | $31.88 billion | N/A |
| Greenhouse gas emission reduction target (EU) | 55% by 2030 | N/A |
| Percentage of new vehicles sold in Norway that are electric (2022) | 37% | N/A |
The combination of these trends and statistics underscores the threat of substitutes facing Hino Motors. As consumer preferences shift towards more sustainable and economical transportation options, the company must adapt to maintain its competitive edge in the evolving market landscape.
Hino Motors, Ltd. - Porter's Five Forces: Threat of new entrants
The automotive industry is characterized by significant barriers to entry, which impacts the threat posed by new entrants. Hino Motors, Ltd., a subsidiary of Toyota, operates in a competitive landscape shaped by various factors that deter potential competitors.
High capital requirements for establishing manufacturing facilities
Entering the automotive market requires substantial investment. For Hino Motors, initial capital expenditure for manufacturing facilities can exceed $1 billion. This encompasses costs for plant construction, machinery, and technology integration. For example, Hino’s Oyama plant, which focuses on trucks, reportedly requires about $300 million in annual operating costs to maintain production levels.
Economies of scale achieved by existing players
Established players like Hino benefit from economies of scale that significantly reduce per-unit costs. In FY 2022, Hino Motors reported production volume of approximately 18,000 units. The average cost per truck decreases as production increases, enabling Hino to maintain competitive pricing. In comparison, new entrants would face higher costs due to lower production outputs, impacting their ability to compete effectively.
Regulatory and compliance standards act as barriers
The automotive sector is highly regulated. Hino Motors adheres to stringent emissions and safety standards. For instance, Hino vehicles must comply with the European Union’s Euro 6 emissions regulations, which require significant investment in R&D and manufacturing processes. Compliance with these standards can incur costs ranging from $5 million to $50 million depending on the technology needed to meet these requirements.
Established brand loyalty among existing customers
Brand loyalty plays a crucial role in the automotive market. Hino Motors enjoys strong brand recognition due to its longstanding reputation in the truck and bus manufacturing segments. As of 2022, Hino achieved a market share of approximately 22% in Japan’s medium-duty truck segment. New entrants would need to invest heavily in marketing and customer acquisition to overcome the established loyalty among existing customers.
| Barrier to Entry | Details | Estimated Costs |
|---|---|---|
| Capital Requirements | Manufacturing facilities and technology | Over $1 billion |
| Production Volume | Annual production volume for Hino | 18,000 units |
| Compliance Costs | Meeting regulatory standards | $5 million - $50 million |
| Market Share | Hino's share in medium-duty trucks (Japan) | 22% |
Overall, these factors combine to create a challenging environment for new entrants looking to penetrate the market in which Hino Motors operates.
Understanding Hino Motors, Ltd. through Porter's Five Forces reveals a landscape where supplier power is limited yet crucial, customer demands are evolving towards sustainability, and fierce competition looms from established global players. The threat of substitutes and new entrants adds layers of complexity, making strategic agility essential for Hino to navigate these dynamic market conditions.
[right_small]Disclaimer
All information, articles, and product details provided on this website are for general informational and educational purposes only. We do not claim any ownership over, nor do we intend to infringe upon, any trademarks, copyrights, logos, brand names, or other intellectual property mentioned or depicted on this site. Such intellectual property remains the property of its respective owners, and any references here are made solely for identification or informational purposes, without implying any affiliation, endorsement, or partnership.
We make no representations or warranties, express or implied, regarding the accuracy, completeness, or suitability of any content or products presented. Nothing on this website should be construed as legal, tax, investment, financial, medical, or other professional advice. In addition, no part of this site—including articles or product references—constitutes a solicitation, recommendation, endorsement, advertisement, or offer to buy or sell any securities, franchises, or other financial instruments, particularly in jurisdictions where such activity would be unlawful.
All content is of a general nature and may not address the specific circumstances of any individual or entity. It is not a substitute for professional advice or services. Any actions you take based on the information provided here are strictly at your own risk. You accept full responsibility for any decisions or outcomes arising from your use of this website and agree to release us from any liability in connection with your use of, or reliance upon, the content or products found herein.