
|
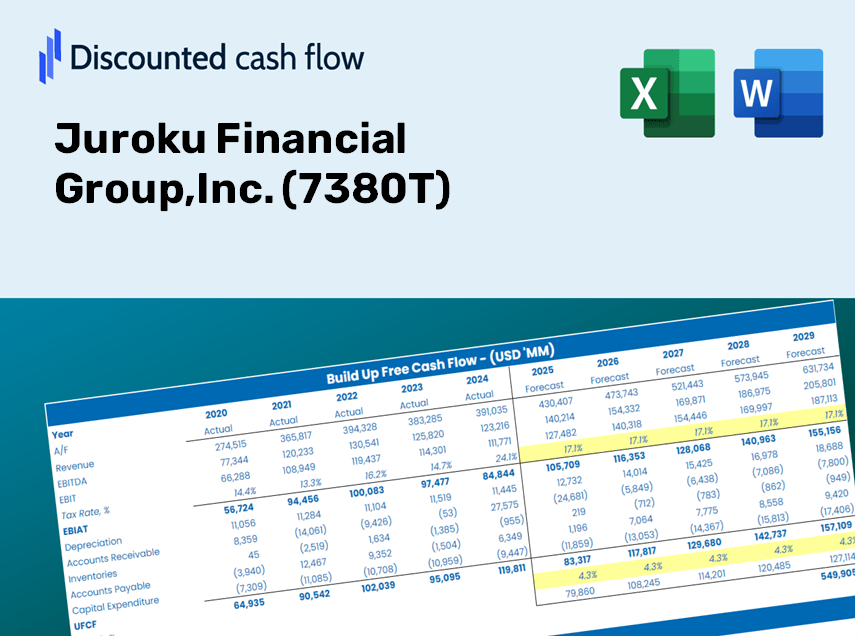
Juroku Financial Group,Inc. (7380.T) DCF Valuation |
Fully Editable: Tailor To Your Needs In Excel Or Sheets
Professional Design: Trusted, Industry-Standard Templates
Investor-Approved Valuation Models
MAC/PC Compatible, Fully Unlocked
No Expertise Is Needed; Easy To Follow
Juroku Financial Group,Inc. (7380.T) Bundle
Looking to determine the intrinsic value of Juroku Financial Group, Inc.? Our (7380T) DCF Calculator offers real-world data along with extensive customization features, allowing you to refine your forecasts and enhance your investment strategies.
Discounted Cash Flow (DCF) - (USD MM)
| Year | AY1 2020 |
AY2 2021 |
AY3 2022 |
AY4 2023 |
AY5 2024 |
FY1 2025 |
FY2 2026 |
FY3 2027 |
FY4 2028 |
FY5 2029 |
|---|---|---|---|---|---|---|---|---|---|---|
| Revenue | 110,498.0 | 111,267.0 | 107,103.0 | 122,687.0 | 125,003.0 | 129,188.0 | 133,513.2 | 137,983.1 | 142,602.8 | 147,377.0 |
| Revenue Growth, % | 0 | 0.69594 | -3.74 | 14.55 | 1.89 | 3.35 | 3.35 | 3.35 | 3.35 | 3.35 |
| EBITDA | 25,955.0 | 30,459.0 | 30,488.0 | 31,528.0 | 31,997.0 | 33,750.3 | 34,880.3 | 36,048.0 | 37,254.9 | 38,502.2 |
| EBITDA, % | 23.49 | 27.37 | 28.47 | 25.7 | 25.6 | 26.12 | 26.12 | 26.12 | 26.12 | 26.12 |
| Depreciation | .0 | 3,814.0 | 3,490.0 | 3,727.0 | .0 | 2,512.5 | 2,596.6 | 2,683.5 | 2,773.4 | 2,866.2 |
| Depreciation, % | 0 | 3.43 | 3.26 | 3.04 | 0 | 1.94 | 1.94 | 1.94 | 1.94 | 1.94 |
| EBIT | 25,955.0 | 26,645.0 | 26,998.0 | 27,801.0 | 31,997.0 | 31,237.8 | 32,283.7 | 33,364.5 | 34,481.5 | 35,635.9 |
| EBIT, % | 23.49 | 23.95 | 25.21 | 22.66 | 25.6 | 24.18 | 24.18 | 24.18 | 24.18 | 24.18 |
| Total Cash | 947,015.0 | 2,135,810.0 | 752,030.0 | 973,951.0 | 1,076,465.0 | 129,188.0 | 133,513.2 | 137,983.1 | 142,602.8 | 147,377.0 |
| Total Cash, percent | .0 | .0 | .0 | .0 | .0 | .0 | .0 | .0 | .0 | .0 |
| Account Receivables | .0 | .0 | .0 | .0 | .0 | .0 | .0 | .0 | .0 | .0 |
| Account Receivables, % | 0 | 0 | 0 | 0 | 0 | 0 | 0 | 0 | 0 | 0 |
| Inventories | .0 | .0 | .0 | .0 | .0 | .0 | .0 | .0 | .0 | .0 |
| Inventories, % | 0 | 0 | 0 | 0 | 0 | 0 | 0 | 0 | 0 | 0 |
| Accounts Payable | .0 | .0 | .0 | .0 | .0 | .0 | .0 | .0 | .0 | .0 |
| Accounts Payable, % | 0 | 0 | 0 | 0 | 0 | 0 | 0 | 0 | 0 | 0 |
| Capital Expenditure | -1,981.0 | -3,365.0 | -2,571.0 | -2,082.0 | -2,076.0 | -2,732.4 | -2,823.9 | -2,918.4 | -3,016.1 | -3,117.1 |
| Capital Expenditure, % | -1.79 | -3.02 | -2.4 | -1.7 | -1.66 | -2.12 | -2.12 | -2.12 | -2.12 | -2.12 |
| Tax Rate, % | 31.95 | 31.95 | 31.95 | 31.95 | 31.95 | 31.95 | 31.95 | 31.95 | 31.95 | 31.95 |
| EBITAT | 16,965.7 | 17,191.6 | 18,631.4 | 19,318.0 | 21,775.1 | 21,019.1 | 21,722.8 | 22,450.1 | 23,201.7 | 23,978.5 |
| Depreciation | ||||||||||
| Changes in Account Receivables | ||||||||||
| Changes in Inventories | ||||||||||
| Changes in Accounts Payable | ||||||||||
| Capital Expenditure | ||||||||||
| UFCF | 14,984.7 | 17,640.6 | 19,550.4 | 20,963.0 | 19,699.1 | 20,799.2 | 21,495.6 | 22,215.2 | 22,959.0 | 23,727.6 |
| WACC, % | 2.82 | 2.8 | 2.92 | 2.93 | 2.89 | 2.87 | 2.87 | 2.87 | 2.87 | 2.87 |
| PV UFCF | ||||||||||
| SUM PV UFCF | 102,029.6 | |||||||||
| Long Term Growth Rate, % | 2.00 | |||||||||
| Free cash flow (T + 1) | 24,202 | |||||||||
| Terminal Value | 2,772,364 | |||||||||
| Present Terminal Value | 2,406,266 | |||||||||
| Enterprise Value | 2,508,296 | |||||||||
| Net Debt | -449,834 | |||||||||
| Equity Value | 2,958,130 | |||||||||
| Diluted Shares Outstanding, MM | 36 | |||||||||
| Equity Value Per Share | 81,944.93 |
What Awaits You
- Authentic Juroku Financial Data: Comes pre-loaded with Juroku Financial Group, Inc.’s historical and projected metrics for thorough analysis.
- Fully Customizable Template: Effortlessly adjust critical inputs such as revenue growth, WACC, and EBITDA percentage.
- Instant Calculations: Watch as Juroku's intrinsic value recalibrates immediately in response to your modifications.
- Expert Valuation Tool: Tailored for investors, analysts, and consultants in pursuit of reliable DCF outcomes.
- User-Friendly Interface: Intuitive layout and straightforward guidance suitable for all levels of expertise.
Core Capabilities
- Customizable Financial Inputs: Adjust essential parameters such as revenue growth, EBITDA margins, and capital expenditures.
- Instant DCF Valuation: Automatically computes intrinsic value, NPV, and other metrics in real-time.
- High-Precision Accuracy: Leverages Juroku Financial Group's (7380T) data for dependable valuation results.
- Simplified Scenario Analysis: Effortlessly explore various assumptions and evaluate outcomes side by side.
- Efficiency Booster: Avoid the hassle of creating intricate valuation models from the ground up.
How It Functions
- Download: Get the pre-prepared Excel file containing Juroku Financial Group, Inc.'s (7380T) financial data.
- Customize: Modify projections such as revenue growth, EBITDA %, and WACC to fit your analysis.
- Update Automatically: Enjoy real-time updates on intrinsic value and NPV calculations.
- Test Scenarios: Generate various projections and immediately compare the results.
- Make Decisions: Leverage the valuation insights to shape your investment strategy.
Why Opt for Juroku Financial Group, Inc. ([7380T]) Calculator?
- All-in-One Solution: Consolidates DCF, WACC, and financial ratio analyses for comprehensive evaluations.
- Flexible Input Options: Modify the yellow-highlighted cells to explore a range of financial scenarios.
- In-Depth Analysis: Automatically computes the intrinsic value and Net Present Value for Juroku Financial Group, Inc.
- Ready-to-Use Data: Incorporates both historical and projected data for reliable analysis.
- High-Quality Standards: Tailored for financial analysts, investors, and business advisors seeking precision.
Who Can Benefit from Juroku Financial Group, Inc. (7380T)?
- Finance Students: Discover valuation strategies and practice them with actual market data.
- Researchers: Integrate advanced financial models into your studies or academic papers.
- Investors: Challenge your investment theories and evaluate valuation results for Juroku Financial Group, Inc. (7380T).
- Financial Analysts: Enhance your efficiency with a ready-to-use, adaptable DCF model.
- Entrepreneurs: Learn how major public firms like Juroku Financial Group, Inc. (7380T) are assessed in the financial landscape.
What This Template Offers
- Pre-Filled Data: Features Juroku Financial Group, Inc.'s historical financials and projections.
- Discounted Cash Flow Model: An editable DCF valuation model with automated calculations.
- Weighted Average Cost of Capital (WACC): A dedicated sheet for calculating WACC using your custom inputs.
- Key Financial Ratios: Evaluate Juroku’s profitability, efficiency, and leverage metrics.
- Customizable Inputs: Easily adjust revenue growth rates, profit margins, and tax rates.
- Clear Dashboard: Visualizations and tables that summarize essential valuation outcomes.
Disclaimer
All information, articles, and product details provided on this website are for general informational and educational purposes only. We do not claim any ownership over, nor do we intend to infringe upon, any trademarks, copyrights, logos, brand names, or other intellectual property mentioned or depicted on this site. Such intellectual property remains the property of its respective owners, and any references here are made solely for identification or informational purposes, without implying any affiliation, endorsement, or partnership.
We make no representations or warranties, express or implied, regarding the accuracy, completeness, or suitability of any content or products presented. Nothing on this website should be construed as legal, tax, investment, financial, medical, or other professional advice. In addition, no part of this site—including articles or product references—constitutes a solicitation, recommendation, endorsement, advertisement, or offer to buy or sell any securities, franchises, or other financial instruments, particularly in jurisdictions where such activity would be unlawful.
All content is of a general nature and may not address the specific circumstances of any individual or entity. It is not a substitute for professional advice or services. Any actions you take based on the information provided here are strictly at your own risk. You accept full responsibility for any decisions or outcomes arising from your use of this website and agree to release us from any liability in connection with your use of, or reliance upon, the content or products found herein.