
|
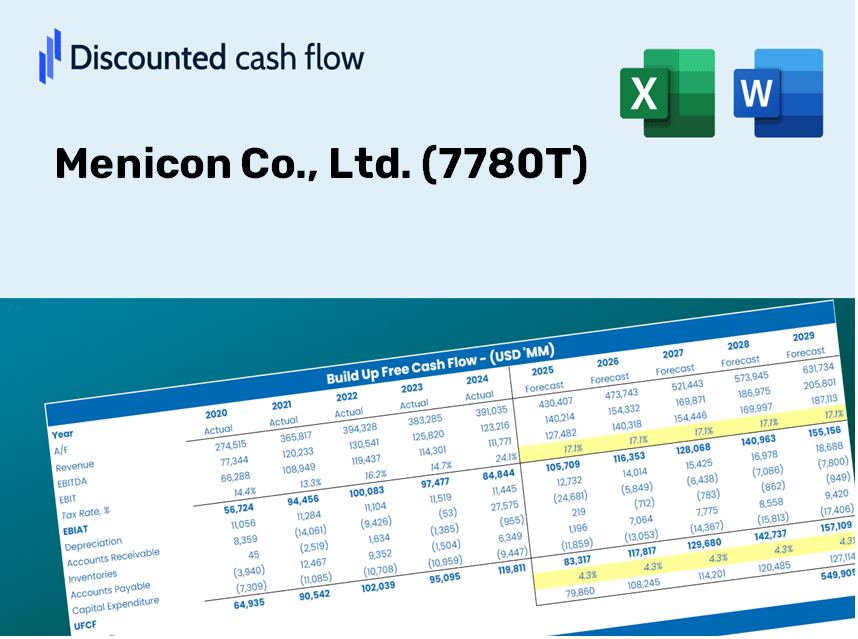
Menicon Co., Ltd. (7780.T) DCF Valuation |
Fully Editable: Tailor To Your Needs In Excel Or Sheets
Professional Design: Trusted, Industry-Standard Templates
Investor-Approved Valuation Models
MAC/PC Compatible, Fully Unlocked
No Expertise Is Needed; Easy To Follow
Menicon Co., Ltd. (7780.T) Bundle
Enhance your investment strategies with the Menicon Co., Ltd. (7780T) DCF Calculator! Explore actual financial data, adjust growth projections and expenses, and instantly observe how modifications affect Menicon Co., Ltd. (7780T) intrinsic value.
Discounted Cash Flow (DCF) - (USD MM)
| Year | AY1 2020 |
AY2 2021 |
AY3 2022 |
AY4 2023 |
AY5 2024 |
FY1 2025 |
FY2 2026 |
FY3 2027 |
FY4 2028 |
FY5 2029 |
|---|---|---|---|---|---|---|---|---|---|---|
| Revenue | 86,209.0 | 100,172.0 | 110,194.0 | 116,192.0 | 121,491.0 | 125,055.5 | 127,416.0 | 128,963.3 | 129,970.8 | 130,624.1 |
| Revenue Growth, % | 0 | 16.2 | 10 | 5.44 | 4.56 | 2.93 | 1.89 | 1.21 | 0.78124 | 0.5026 |
| EBITDA | 14,135.0 | 17,525.0 | 19,327.0 | 15,737.0 | 18,525.0 | 20,064.5 | 20,443.2 | 20,691.4 | 20,853.1 | 20,957.9 |
| EBITDA, % | 16.4 | 17.49 | 17.54 | 13.54 | 15.25 | 16.04 | 16.04 | 16.04 | 16.04 | 16.04 |
| Depreciation | 6,028.0 | 7,293.0 | 7,448.0 | 7,947.0 | 8,450.0 | 8,710.5 | 8,874.9 | 8,982.7 | 9,052.9 | 9,098.4 |
| Depreciation, % | 6.99 | 7.28 | 6.76 | 6.84 | 6.96 | 6.97 | 6.97 | 6.97 | 6.97 | 6.97 |
| EBIT | 8,107.0 | 10,232.0 | 11,879.0 | 7,790.0 | 10,075.0 | 11,353.9 | 11,568.3 | 11,708.7 | 11,800.2 | 11,859.5 |
| EBIT, % | 9.4 | 10.21 | 10.78 | 6.7 | 8.29 | 9.08 | 9.08 | 9.08 | 9.08 | 9.08 |
| Total Cash | 41,455.0 | 33,046.0 | 41,285.0 | 46,911.0 | 42,046.0 | 48,402.4 | 49,316.0 | 49,914.9 | 50,304.9 | 50,557.7 |
| Total Cash, percent | .0 | .0 | .0 | .0 | .0 | .0 | .0 | .0 | .0 | .0 |
| Account Receivables | 10,557.0 | 11,129.0 | 12,250.0 | 13,205.0 | 13,168.0 | 14,175.3 | 14,442.8 | 14,618.2 | 14,732.4 | 14,806.5 |
| Account Receivables, % | 12.25 | 11.11 | 11.12 | 11.36 | 10.84 | 11.34 | 11.34 | 11.34 | 11.34 | 11.34 |
| Inventories | 15,500.0 | 15,783.0 | 17,417.0 | 18,802.0 | 21,218.0 | 20,806.2 | 21,198.9 | 21,456.3 | 21,624.0 | 21,732.6 |
| Inventories, % | 17.98 | 15.76 | 15.81 | 16.18 | 17.46 | 16.64 | 16.64 | 16.64 | 16.64 | 16.64 |
| Accounts Payable | 4,205.0 | 4,894.0 | 5,609.0 | 6,181.0 | 6,419.0 | 6,762.7 | 7,048.4 | 7,293.8 | 7,511.6 | 7,710.8 |
| Accounts Payable, % | 4.88 | 4.89 | 5.09 | 5.32 | 5.28 | 5.41 | 5.53 | 5.66 | 5.78 | 5.9 |
| Capital Expenditure | -11,875.0 | -15,946.0 | -12,975.0 | -21,334.0 | -14,021.0 | -17,850.4 | -18,187.3 | -18,408.2 | -18,552.0 | -18,645.2 |
| Capital Expenditure, % | -13.77 | -15.92 | -11.77 | -18.36 | -11.54 | -14.27 | -14.27 | -14.27 | -14.27 | -14.27 |
| Tax Rate, % | 39.7 | 39.7 | 39.7 | 39.7 | 39.7 | 39.7 | 39.7 | 39.7 | 39.7 | 39.7 |
| EBITAT | 5,776.7 | 6,698.3 | 7,608.2 | 4,968.5 | 6,075.5 | 7,376.7 | 7,515.9 | 7,607.2 | 7,666.6 | 7,705.2 |
| Depreciation | ||||||||||
| Changes in Account Receivables | ||||||||||
| Changes in Inventories | ||||||||||
| Changes in Accounts Payable | ||||||||||
| Capital Expenditure | ||||||||||
| UFCF | -21,922.3 | -2,120.7 | 41.2 | -10,186.5 | -1,636.5 | -2,014.9 | -2,171.0 | -2,005.7 | -1,896.5 | -1,825.2 |
| WACC, % | 5.28 | 5.21 | 5.19 | 5.18 | 5.14 | 5.2 | 5.2 | 5.2 | 5.2 | 5.2 |
| PV UFCF | ||||||||||
| SUM PV UFCF | -8,564.8 | |||||||||
| Long Term Growth Rate, % | 2.00 | |||||||||
| Free cash flow (T + 1) | -1,862 | |||||||||
| Terminal Value | -58,191 | |||||||||
| Present Terminal Value | -45,163 | |||||||||
| Enterprise Value | -53,728 | |||||||||
| Net Debt | 33,043 | |||||||||
| Equity Value | -86,771 | |||||||||
| Diluted Shares Outstanding, MM | 82 | |||||||||
| Equity Value Per Share | -1,063.60 |
What You Will Receive
- Genuine Menicon Data: Loaded financials – encompassing everything from revenue to EBIT – based on real and projected statistics.
- Comprehensive Customization: Modify all essential parameters (yellow cells) such as WACC, growth %, and tax rates.
- Immediate Valuation Adjustments: Automatic recalculations to evaluate the effects of changes on Menicon’s fair value.
- Flexible Excel Template: Designed for quick modifications, scenario analysis, and thorough projections.
- Efficient and Accurate: Bypass the need to build models from the ground up while ensuring accuracy and adaptability.
Key Features
- Authentic Menicon Financial Data: Access reliable pre-loaded historical information and future forecasts.
- Adjustable Forecast Inputs: Modify the highlighted fields for metrics like WACC, growth rates, and profit margins.
- Automated Calculations: Get real-time updates for DCF, Net Present Value (NPV), and cash flow analyses.
- Interactive Dashboard: User-friendly charts and summaries to clearly display your valuation outcomes.
- Designed for All Levels: An accessible and straightforward layout tailored for investors, CFOs, and consultants.
How It Works
- Step 1: Download the Excel file.
- Step 2: Review Menicon Co., Ltd.'s pre-filled financial data and forecasts.
- Step 3: Adjust key inputs such as revenue growth, WACC, and tax rates (highlighted cells).
- Step 4: Observe the DCF model refresh in real-time as you modify your assumptions.
- Step 5: Evaluate the results and leverage the outputs for your investment strategies.
Why Opt for Menicon Co., Ltd. (7780T) Calculator?
- Precision: Based on accurate Menicon financial data for reliable results.
- Versatility: Tailored for users to easily adjust and explore different inputs.
- Efficiency: Bypass the complexities of creating a DCF model from the ground up.
- Expert-Quality: Crafted with the sophistication and functionality expected by CFOs.
- Intuitive: Simple to navigate, suitable for individuals without extensive financial modeling skills.
Who Will Benefit from Menicon Co., Ltd. (7780T)?
- Investors: Gain insights with a robust valuation tool tailored for informed decision-making.
- Financial Analysts: Enhance productivity with a customizable DCF model readily available.
- Consultants: Effortlessly tweak the template for impactful client presentations or reports.
- Finance Enthusiasts: Expand your knowledge of valuation methods through practical, real-life examples.
- Educators and Students: Utilize it as a valuable resource for finance-related academic courses.
Contents of the Template
- Pre-Filled Data: Contains Menicon Co., Ltd.'s historical financial data and forecasts.
- Discounted Cash Flow Model: An editable DCF valuation model featuring automatic calculations.
- Weighted Average Cost of Capital (WACC): A specific worksheet for calculating WACC using customized inputs.
- Key Financial Ratios: Assess Menicon Co., Ltd.'s profitability, efficiency, and financial leverage.
- Customizable Inputs: Easily modify revenue growth, margins, and tax rates.
- Clear Dashboard: Visual charts and tables summarizing essential valuation outcomes.
Disclaimer
All information, articles, and product details provided on this website are for general informational and educational purposes only. We do not claim any ownership over, nor do we intend to infringe upon, any trademarks, copyrights, logos, brand names, or other intellectual property mentioned or depicted on this site. Such intellectual property remains the property of its respective owners, and any references here are made solely for identification or informational purposes, without implying any affiliation, endorsement, or partnership.
We make no representations or warranties, express or implied, regarding the accuracy, completeness, or suitability of any content or products presented. Nothing on this website should be construed as legal, tax, investment, financial, medical, or other professional advice. In addition, no part of this site—including articles or product references—constitutes a solicitation, recommendation, endorsement, advertisement, or offer to buy or sell any securities, franchises, or other financial instruments, particularly in jurisdictions where such activity would be unlawful.
All content is of a general nature and may not address the specific circumstances of any individual or entity. It is not a substitute for professional advice or services. Any actions you take based on the information provided here are strictly at your own risk. You accept full responsibility for any decisions or outcomes arising from your use of this website and agree to release us from any liability in connection with your use of, or reliance upon, the content or products found herein.