
|
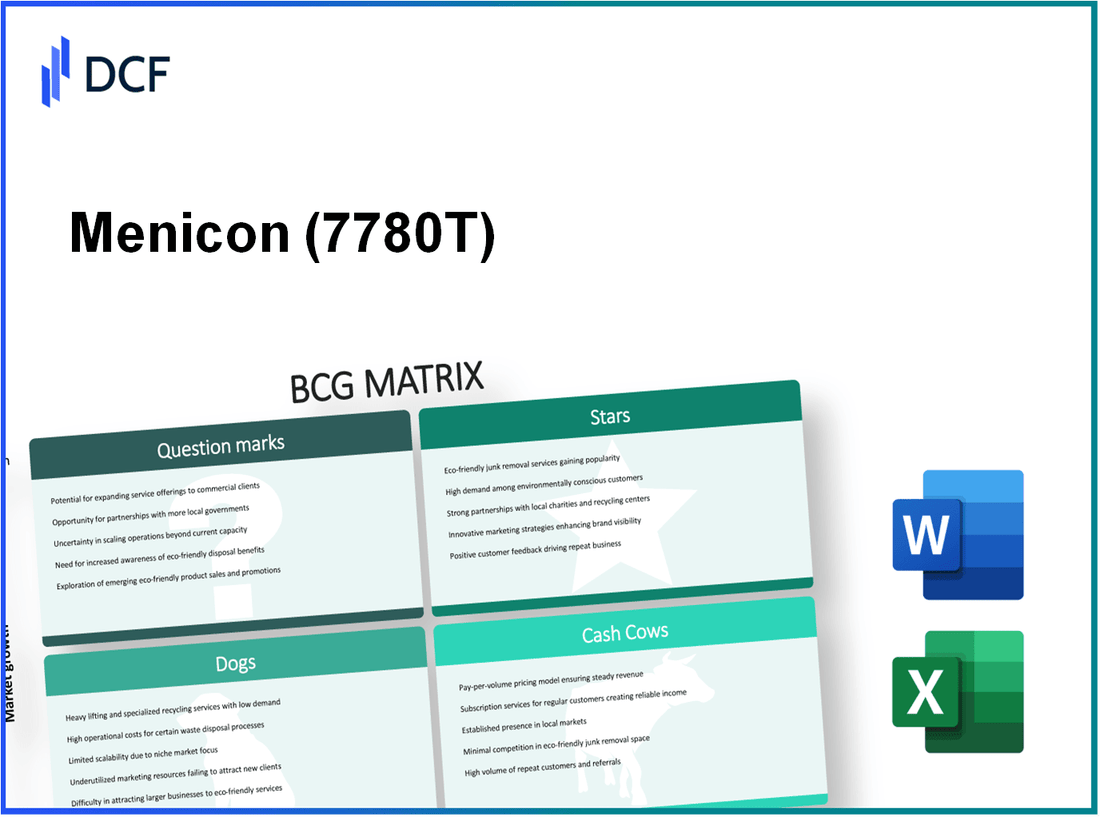
Menicon Co., Ltd. (7780.T): BCG Matrix [Dec-2025 Updated] |
Fully Editable: Tailor To Your Needs In Excel Or Sheets
Professional Design: Trusted, Industry-Standard Templates
Investor-Approved Valuation Models
MAC/PC Compatible, Fully Unlocked
No Expertise Is Needed; Easy To Follow
Menicon Co., Ltd. (7780.T) Bundle
Menicon's portfolio pairs high-growth "stars" - Bloom myopia control, Miru daily disposables and China orthokeratology - that are eating capital for international expansion, with fat cash cows - the MELS subscription, care solutions and legacy RGPs - that generate the free cash to fund that push; selective bets in veterinary eye care, environmental biotech and North America need careful scaling, while declining legacy soft lenses and old RGP accessories are being harvested or phased out, making capital allocation decisions the company's single most important lever for sustaining momentum. Continue reading to see how these trade-offs shape Menicon's strategy and investment priorities.
Menicon Co., Ltd. (7780.T) - BCG Matrix Analysis: Stars
Stars
The Bloom myopia control system is positioned as a Star, driven by a global myopia management market growing at 15.5% annually. Menicon's Bloom system holds a 12% share in the specialized pediatric myopia segment across Europe and China as of late 2025, contributing 14% to total international revenue. Targeted R&D spending for Bloom increased by 20%, supporting product differentiation and clinical evidence. Operating margins for Bloom's specialized therapeutic lenses are 19%, reflecting significant technical barriers to entry. Menicon has budgeted ¥5,000,000,000 in capital expenditure to expand clinical support networks, with an expected 20% ROI by 2027.
| Metric | Value |
|---|---|
| Market growth (global myopia management) | 15.5% annually |
| Market share (pediatric segment, Europe & China, 2025) | 12% |
| Contribution to international revenue | 14% |
| R&D spend increase | +20% |
| Operating margin | 19% |
| CapEx allocated | ¥5,000,000,000 |
| Target ROI (by 2027) | 20% |
The Miru daily disposable lens range is another Star, accounting for 42% of Menicon's total contact lens sales revenue. The global daily disposable market is expanding at 8.2% annually; Menicon commands a 10% share of the premium silicone hydrogel category. To scale production, Menicon has invested ¥12,000,000,000 in high-speed automated production lines in Malaysia. Miru sustains a 17% operating margin, supported by economies of scale and proprietary Flat Pack packaging technology. Segment-level ROI stands at 16%, underscoring Miru's role as a core growth engine.
| Metric | Value |
|---|---|
| Share of contact lens sales (Miru) | 42% |
| Market growth (global daily disposable) | 8.2% annually |
| Premium silicone hydrogel market share | 10% |
| CapEx (Malaysia production) | ¥12,000,000,000 |
| Operating margin | 17% |
| Segment ROI | 16% |
| Key advantage | Flat Pack technology; economies of scale |
Orthokeratology (Ortho-K), led by Menicon Z Night, constitutes a third Star, dominating the Chinese overnight lens market with a 24% market share. The regional market growth rate is 18%, and Ortho-K sales represent 15% of Menicon's consolidated overseas revenue. Premium pricing for custom-designed rigid lenses drives a 21% return on assets in this segment. Strategic investments in localized distribution and clinical training have produced a 25% year-on-year increase in segment profitability.
| Metric | Value |
|---|---|
| Market share (China, Ortho-K) | 24% |
| Regional market growth (China Ortho-K) | 18% annually |
| Share of consolidated overseas revenue | 15% |
| Return on assets | 21% |
| YoY increase in segment profitability | 25% |
| Strategic focus | Local distribution, clinical training, premium pricing |
- Investment priorities: Allocate additional R&D to Bloom (targeted clinical studies), scale Miru production capacity in APAC, and deepen Ortho-K clinical partnerships in China.
- Financial targets: Maintain Bloom ROI target of 20% by 2027, sustain Miru segment ROI at ≥16%, and protect Ortho-K ROA at ~21% through pricing and cost control.
- Operational initiatives: Expand clinical support networks (Bloom), optimize automated production throughput (Miru), and enhance local distribution and practitioner training (Ortho-K).
Menicon Co., Ltd. (7780.T) - BCG Matrix Analysis: Cash Cows
Cash Cows
The Menicon Eye Life Support (MELS) Plan is the company's principal cash cow, delivering stable, recurring cash flows from a substantial subscription base. With 1.35 million active members and a 92% retention rate, MELS accounts for 45% of Menicon's total annual revenue. The subscription model requires minimal capital reinvestment (typically below 3% of segment revenue) and posts an exceptional operating margin of 24%, producing approximately ¥12.0 billion in free cash flow annually that underpins the group's strategic investments in higher-growth markets.
Contact lens care solutions remain a reliable profit center with a steady domestic market share and high returns. Menicon holds roughly 30% of the Japanese care-solutions market where growth is muted at ~1.2% annually due to substitution by daily disposables. The care segment contributes ~11% of total corporate revenue, operates at a ~22% margin, and benefits from fully depreciated manufacturing assets, producing a high return on investment (~19%) while requiring negligible R&D reinvestment to sustain its market position.
The legacy rigid gas permeable (RGP) lens business continues to generate steady cash flows from a loyal niche. Menicon commands ~35% share of the RGP market in Japan, a market growing at ~0.5% annually. The segment contributes about 8% of total revenue, operates at a ~20% margin, and maintains return on assets near 17% while capital expenditure is confined to maintenance levels. Cash generated by this mature product line is redirected to accelerate growth of Miru and Bloom product families.
| Metric | MELS Plan | Care Solutions | RGP Lenses |
|---|---|---|---|
| Active Members / Market Share | 1.35 million subscribers | ~30% domestic market share | ~35% niche RGP market share (Japan) |
| Contribution to Total Revenue | 45% | 11% | 8% |
| Approx. Segment Revenue (¥) | ¥50.0 billion (estimate) | ¥12.2 billion (estimate) | ¥8.9 billion (estimate) |
| Market Growth Rate | Subscription renewals stable; effective growth ~2-3% annually | ~1.2% per year | ~0.5% per year |
| Operating Margin | 24% | 22% | 20% |
| Free Cash Flow / Operating Profit (approx.) | ¥12.0 billion FCF (reported) | ¥2.7 billion operating profit (est.) | ¥1.8 billion operating profit (est.) |
| Retention / Customer Loyalty | 92% retention | High brand loyalty; repeat purchase behavior | Strong clinical & brand loyalty |
| CapEx / Reinvestment | <3% of segment revenue (maintenance) | Negligible R&D; manufacturing fully depreciated | Maintenance-level CapEx only |
| Return Metrics | High cash conversion; funds global initiatives | ROI ~19% | Return on Assets ~17% |
Key cash deployment and risk-management actions supported by these cash cows:
- Allocate annual ¥12.0 billion (MELS FCF) plus surplus from care/RGP to fund Miru and Bloom international expansion and targeted M&A.
- Maintain low reinvestment in mature segments: capex cap at <3% of segment revenue for MELS, maintenance-only for RGP, minimal R&D for care solutions.
- Preserve subscription retention via loyalty programs, digital engagement, and tiered pricing to protect recurring revenue.
- Monitor margin pressure from unit-cost changes and competitive discounting in care products; hedge supplier and FX exposures where applicable.
Quantitative sensitivities to monitor for cash-cow sustainability:
- 1 percentage-point decline in MELS retention (from 92% to 91%) could reduce annual MELS revenue by ~¥1.1 billion (≈1% of total revenue) and materially lower FCF.
- A 2% drop in care market share would reduce care revenue by ~¥0.24 billion annually, compressing operating profit by ~¥0.05 billion at current margins.
- Extended migration from RGP to disposables could erode RGP revenue by 1-2% annually; however, low fixed costs and maintenance CapEx keep margins resilient in the near term.
Menicon Co., Ltd. (7780.T) - BCG Matrix Analysis: Question Marks
Question Marks
Veterinary ophthalmology business targets pet healthcare
The Meni-one subsidiary represents a high-potential venture in a global veterinary eye care market growing at 11.0% annually. This segment currently accounts for 2.5% of Menicon's total revenue (FY latest), reflecting low relative market share but elevated market growth. Capital expenditure for veterinary intraocular lenses has increased by 35% year-over-year to accelerate product development and premium positioning. Current operating margins are thin at approximately 6.0% due to elevated regulatory, clinical trial, and market entry costs. Menicon targets a 10.0% global veterinary ophthalmology market share within five years, implying a revenue compound annual growth rate (CAGR) for the segment materially above corporate average if targets are met.
| Metric | Current Value | Target / Forecast | Notes |
|---|---|---|---|
| Segment revenue (% of consolidated) | 2.5% | 10.0% target market share (global ophthalmology) | Low base; scalable premium product line |
| Market growth rate | 11.0% p.a. | - | Global veterinary ophthalmology growth |
| CapEx increase (YoY) | +35% | Continued investment planned | Focus on intraocular lenses |
| Operating margin | 6.0% | Target >15% long-term | Currently depressed by entry costs |
| Five-year market share goal | - | 10.0% | Global veterinary ophthalmology |
Environmental and life science initiatives seek scale
Menicon's environmental product line, including rice straw decomposition agents and related bio-based solutions, targets a sustainability market growing at 14.0% annually. This business unit contributes less than 1.5% to consolidated sales, placing it firmly in a low-share, high-growth quadrant. Management has committed 2.5 billion yen to biological R&D and pilot-scale fermentation facilities to convert fermentation expertise into industrial environmental applications. Operating margins are near break-even at present as emphasis is on pilot projects, regulatory validation, and market penetration rather than short-term profitability. The company aims to capture 5.0% of targeted industrial environmental niches by 2030, contingent on successful scale-up and commercialization.
| Metric | Current Value | Investment / Target | Notes |
|---|---|---|---|
| Segment revenue (% of consolidated) | <1.5% | - | Nascent revenue contribution |
| Market growth rate | 14.0% p.a. | - | Sustainability/environmental market |
| Committed R&D investment | 2.5 billion JPY | Additional scale-up capex planned | Fermentation and biotech platforms |
| Operating margin | ~0% (near break-even) | Target positive margins post-scale | Early-stage commercialization |
| 2030 market share goal | - | 5.0% | Target within defined niches |
- Key risks: long commercialization timelines, regulatory hurdles, need for manufacturing scale.
- Key enablers: proprietary fermentation IP, access to agricultural channels, sustainability tailwinds.
Global expansion of daily disposables in North America
Menicon is a domestic leader in Japan but holds under 3.0% market share in the North American daily disposable soft contact lens market. The U.S. contact lens market is expanding at an estimated 7.5% annually, representing a high-growth geographic opportunity. Menicon has increased regional capital allocation by 15.0% for 2025, directed toward marketing, clinical partnerships, and distribution agreements to improve retail and practitioner access. Current ROI for North America is modest at approximately 5.0% due to heavy promotional spend and competitive pricing pressure from established global incumbents. Management anticipates scale benefits and margin improvement as distribution density increases and product awareness grows.
| Metric | Current Value | 2025 Allocation / Goal | Notes |
|---|---|---|---|
| North America market share | <3.0% | Target incremental share gains | Daily disposable lenses |
| U.S. market growth rate | 7.5% p.a. | - | Contact lens category expansion |
| Regional capital allocation change | +15.0% (2025) | Continued marketing/distribution spend | Focus on practitioner channels |
| Current ROI (North America) | ~5.0% | Target >12% with scale | Low due to competitive dynamics |
| Near-term priorities | Market share growth, brand awareness | Distribution partnerships | Promotional and clinical evidence investments |
- Strategic moves: targeted promotion to eye care professionals, competitive pricing trials, and logistics partnerships.
- Metrics to monitor: customer acquisition cost (CAC), lifetime value (LTV), distribution fill rate, gross margin per SKU.
Menicon Co., Ltd. (7780.T) - BCG Matrix Analysis: Dogs
Dogs - Legacy conventional soft lenses face phase out
The legacy conventional (non-disposable) soft contact lens segment is contracting at -8.0% CAGR as consumer preference shifts to daily and monthly disposable formats. Menicon's market share in this declining segment has fallen to 4.0% and the product line now accounts for only 2.0% of consolidated revenue. Operating margin for the legacy soft lens line has compressed to 4.0%, with ROI under 3.0%, reflecting minimal profitability and constrained cash generation. New capital expenditures have been halted; the strategy is deliberate harvest and managed decommissioning of specialized production assets.
| Metric | Value |
|---|---|
| Segment annual growth | -8.0% |
| Menicon market share (legacy soft lenses) | 4.0% |
| Contribution to total revenue | 2.0% |
| Operating margin (legacy soft lenses) | 4.0% |
| Return on investment (ROI) | <3.0% |
| CapEx status | Ceased |
| Inventory turnover (annual) | 1.6x |
| Annual revenue (estimated, JPY) | ¥1.8 billion |
Key operational and financial implications for this dog segment include ongoing fixed-cost drag from specialized production lines, rising per-unit manufacturing cost due to lower volumes, and increased complexity in supply chain management for legacy SKUs. The minimal margin cushion (4.0%) indicates little room for price promotions or extended warranties without generating losses.
- Maintain minimal production to meet contractual obligations and gradual supply tapering.
- Allocate zero new marketing budget; redirect sales efforts to disposable and therapeutic lines.
- Plan phased decommissioning schedule for manufacturing assets over 18-36 months to limit write-offs.
- Monitor channel inventory weekly to avoid obsolescence and excess stock write-downs.
Dogs - Older generation rigid lens accessories see low demand
Accessories tied to discontinued or older rigid gas permeable (RGP) lens models are declining at -6.0% annually. These accessories represent approximately 1.5% of the total accessory market and contribute less than 1.0% to Menicon's corporate EBITDA. Inventory carrying costs relative to revenue are high; low turnover has produced an estimated ROI of 2.5%. Marketing and promotional spend for this category has been reduced to zero; retention of the SKUs is primarily to service long-term warranty and maintenance commitments to legacy RGP users.
| Metric | Value |
|---|---|
| Segment annual growth | -6.0% |
| Accessory market share (RGP legacy accessories) | 1.5% |
| Contribution to corporate EBITDA | <1.0% |
| Inventory holding cost (annual % of value) | 12.0% |
| Inventory turnover (annual) | 0.9x |
| Return on investment (ROI) | 2.5% |
| Marketing spend | ¥0 (reduced to zero) |
| Annual revenue (estimated, JPY) | ¥0.6 billion |
Operational consequences include disproportionate warehousing costs, risk of obsolescence for slow-moving SKUs, and resource allocation to after-sales support for a shrinking user base. The product economics warrant strict maintenance-only posture and exploration of targeted liquidation or aftermarket conversion programs to recover working capital.
- Maintain SKUs solely to meet service-level agreements and legal obligations for existing customers.
- Implement targeted buy-back or upgrade incentives to transition legacy users to current product families.
- Run periodic inventory rationalization (quarterly) with threshold-based discontinuation triggers.
- Negotiate with third-party service providers to outsource final-stage support and reduce fixed overhead.
Disclaimer
All information, articles, and product details provided on this website are for general informational and educational purposes only. We do not claim any ownership over, nor do we intend to infringe upon, any trademarks, copyrights, logos, brand names, or other intellectual property mentioned or depicted on this site. Such intellectual property remains the property of its respective owners, and any references here are made solely for identification or informational purposes, without implying any affiliation, endorsement, or partnership.
We make no representations or warranties, express or implied, regarding the accuracy, completeness, or suitability of any content or products presented. Nothing on this website should be construed as legal, tax, investment, financial, medical, or other professional advice. In addition, no part of this site—including articles or product references—constitutes a solicitation, recommendation, endorsement, advertisement, or offer to buy or sell any securities, franchises, or other financial instruments, particularly in jurisdictions where such activity would be unlawful.
All content is of a general nature and may not address the specific circumstances of any individual or entity. It is not a substitute for professional advice or services. Any actions you take based on the information provided here are strictly at your own risk. You accept full responsibility for any decisions or outcomes arising from your use of this website and agree to release us from any liability in connection with your use of, or reliance upon, the content or products found herein.