
|
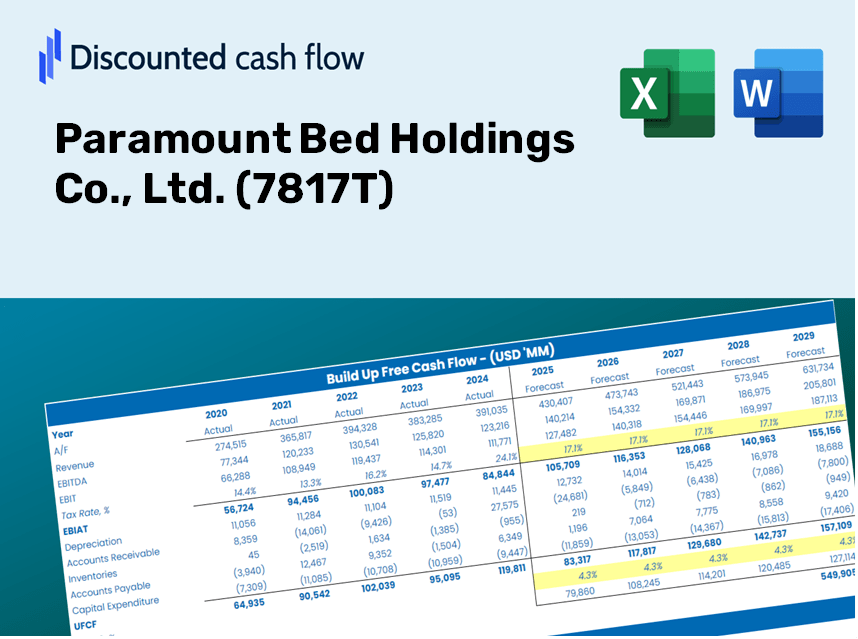
Paramount Bed Holdings Co., Ltd. (7817.T) DCF Valuation |
Fully Editable: Tailor To Your Needs In Excel Or Sheets
Professional Design: Trusted, Industry-Standard Templates
Investor-Approved Valuation Models
MAC/PC Compatible, Fully Unlocked
No Expertise Is Needed; Easy To Follow
Paramount Bed Holdings Co., Ltd. (7817.T) Bundle
Explore the financial outlook of Paramount Bed Holdings Co., Ltd. (7817T) with our user-friendly DCF Calculator! Enter your assumptions for growth, margins, and costs to determine the intrinsic value of Paramount Bed Holdings Co., Ltd. (7817T) and enhance your investment strategy.
Discounted Cash Flow (DCF) - (USD MM)
| Year | AY1 2021 |
AY2 2022 |
AY3 2023 |
AY4 2024 |
AY5 2025 |
FY1 2026 |
FY2 2027 |
FY3 2028 |
FY4 2029 |
FY5 2030 |
|---|---|---|---|---|---|---|---|---|---|---|
| Revenue | 87,171.0 | 90,352.0 | 99,009.0 | 106,016.0 | 108,583.0 | 114,753.0 | 121,273.5 | 128,164.6 | 135,447.2 | 143,143.7 |
| Revenue Growth, % | 0 | 3.65 | 9.58 | 7.08 | 2.42 | 5.68 | 5.68 | 5.68 | 5.68 | 5.68 |
| EBITDA | 20,555.0 | 21,500.0 | 22,445.0 | 25,381.0 | 24,137.0 | 26,672.1 | 28,187.7 | 29,789.4 | 31,482.1 | 33,271.0 |
| EBITDA, % | 23.58 | 23.8 | 22.67 | 23.94 | 22.23 | 23.24 | 23.24 | 23.24 | 23.24 | 23.24 |
| Depreciation | 7,616.0 | 7,974.0 | 8,539.0 | 9,765.0 | 11,138.0 | 10,478.2 | 11,073.6 | 11,702.8 | 12,367.8 | 13,070.5 |
| Depreciation, % | 8.74 | 8.83 | 8.62 | 9.21 | 10.26 | 9.13 | 9.13 | 9.13 | 9.13 | 9.13 |
| EBIT | 12,939.0 | 13,526.0 | 13,906.0 | 15,616.0 | 12,999.0 | 16,194.0 | 17,114.1 | 18,086.6 | 19,114.3 | 20,200.5 |
| EBIT, % | 14.84 | 14.97 | 14.05 | 14.73 | 11.97 | 14.11 | 14.11 | 14.11 | 14.11 | 14.11 |
| Total Cash | 48,362.0 | 54,069.0 | 53,232.0 | 46,746.0 | 43,536.0 | 58,128.1 | 61,431.1 | 64,921.8 | 68,610.8 | 72,509.4 |
| Total Cash, percent | .0 | .0 | .0 | .0 | .0 | .0 | .0 | .0 | .0 | .0 |
| Account Receivables | 27,299.0 | 27,986.0 | 30,236.0 | 36,823.0 | 36,826.0 | 37,060.2 | 39,166.1 | 41,391.6 | 43,743.5 | 46,229.2 |
| Account Receivables, % | 31.32 | 30.97 | 30.54 | 34.73 | 33.92 | 32.3 | 32.3 | 32.3 | 32.3 | 32.3 |
| Inventories | 7,668.0 | 9,641.0 | 11,255.0 | 10,195.0 | 12,475.0 | 11,920.5 | 12,597.9 | 13,313.7 | 14,070.3 | 14,869.8 |
| Inventories, % | 8.8 | 10.67 | 11.37 | 9.62 | 11.49 | 10.39 | 10.39 | 10.39 | 10.39 | 10.39 |
| Accounts Payable | 12,060.0 | 12,917.0 | 13,432.0 | 12,185.0 | 13,701.0 | 15,103.6 | 15,961.8 | 16,868.8 | 17,827.3 | 18,840.3 |
| Accounts Payable, % | 13.83 | 14.3 | 13.57 | 11.49 | 12.62 | 13.16 | 13.16 | 13.16 | 13.16 | 13.16 |
| Capital Expenditure | -3,722.0 | -1,521.0 | -3,802.0 | -4,235.0 | -2,365.0 | -3,664.3 | -3,872.5 | -4,092.5 | -4,325.1 | -4,570.9 |
| Capital Expenditure, % | -4.27 | -1.68 | -3.84 | -3.99 | -2.18 | -3.19 | -3.19 | -3.19 | -3.19 | -3.19 |
| Tax Rate, % | 29.21 | 29.21 | 29.21 | 29.21 | 29.21 | 29.21 | 29.21 | 29.21 | 29.21 | 29.21 |
| EBITAT | 8,659.2 | 9,152.2 | 9,277.7 | 10,701.5 | 9,201.5 | 11,032.0 | 11,658.8 | 12,321.3 | 13,021.4 | 13,761.4 |
| Depreciation | ||||||||||
| Changes in Account Receivables | ||||||||||
| Changes in Inventories | ||||||||||
| Changes in Accounts Payable | ||||||||||
| Capital Expenditure | ||||||||||
| UFCF | -10,353.8 | 13,802.2 | 10,665.7 | 9,457.5 | 17,207.5 | 19,568.7 | 16,934.9 | 17,897.2 | 18,914.1 | 19,988.9 |
| WACC, % | 4.59 | 4.6 | 4.59 | 4.6 | 4.6 | 4.6 | 4.6 | 4.6 | 4.6 | 4.6 |
| PV UFCF | ||||||||||
| SUM PV UFCF | 81,597.7 | |||||||||
| Long Term Growth Rate, % | 2.00 | |||||||||
| Free cash flow (T + 1) | 20,389 | |||||||||
| Terminal Value | 785,426 | |||||||||
| Present Terminal Value | 627,383 | |||||||||
| Enterprise Value | 708,980 | |||||||||
| Net Debt | -28,138 | |||||||||
| Equity Value | 737,118 | |||||||||
| Diluted Shares Outstanding, MM | 57 | |||||||||
| Equity Value Per Share | 12,921.48 |
Benefits You Will Receive
- Customizable Excel Template: A fully adaptable Excel-based DCF Calculator complete with pre-populated financial data for Paramount Bed Holdings Co., Ltd. (7817T).
- Comprehensive Data: Access to historical figures and forward-looking projections (highlighted in the yellow cells).
- Flexible Forecasting: Adjust key assumptions such as revenue growth, EBITDA margins, and WACC.
- Real-Time Calculations: Immediately observe how your inputs affect the valuation of Paramount Bed Holdings Co., Ltd. (7817T).
- Professional Resource: Designed for investors, CFOs, consultants, and financial analysts alike.
- User-Friendly Interface: Organized for clarity and ease of navigation, complete with step-by-step guidance.
Key Features
- Pre-Loaded Data: Paramount Bed Holdings Co., Ltd.'s historical financial statements and pre-filled forecasts.
- Fully Adjustable Inputs: Customize WACC, tax rates, revenue growth, and EBITDA margins.
- Instant Results: Watch Paramount Bed's intrinsic value recalculate in real time.
- Clear Visual Outputs: Dashboard charts provide a visual representation of valuation results and key metrics.
- Built for Accuracy: A professional tool designed for analysts, investors, and finance professionals.
How It Works
- Step 1: Download the prebuilt Excel template that includes data for Paramount Bed Holdings Co., Ltd. (7817T).
- Step 2: Navigate through the pre-filled sheets to familiarize yourself with the essential metrics.
- Step 3: Modify forecasts and assumptions in the editable yellow cells (WACC, growth, margins) as needed.
- Step 4: Instantly see recalculated results, including the intrinsic value of Paramount Bed Holdings Co., Ltd. (7817T).
- Step 5: Use the outputs to make well-informed investment decisions or create detailed reports.
Why Choose This Calculator for Paramount Bed Holdings Co., Ltd. (7817T)?
- User-Friendly Design: Perfect for both novices and seasoned professionals.
- Customizable Parameters: Modify inputs effortlessly to suit your analysis needs.
- Real-Time Insights: Witness immediate updates to Paramount Bed's valuation as you adjust inputs.
- Pre-Loaded Data: Comes equipped with Paramount Bed's latest financial information for swift evaluations.
- Relied Upon by Experts: Trusted by investors and analysts for making well-informed choices.
Who Can Benefit from This Product?
- Healthcare Investors: Develop comprehensive and accurate valuation models for investment analysis in the healthcare sector.
- Corporate Finance Departments: Assess various valuation scenarios to inform strategic decisions within their organizations.
- Financial Consultants and Advisors: Offer clients precise valuation assessments for Paramount Bed Holdings Co., Ltd. (7817T).
- Students and Educators: Utilize real-life data to enhance learning and practice in financial modeling.
- Industry Enthusiasts: Gain insights into the valuation methods of companies like Paramount Bed Holdings Co., Ltd. (7817T) in the healthcare market.
Contents of the Template
- Historical Data: Comprehensive overview of Paramount Bed Holdings Co., Ltd.'s (7817T) previous financial performance and baseline forecasts.
- DCF and Levered DCF Models: In-depth templates designed to assess the intrinsic value of Paramount Bed Holdings Co., Ltd. (7817T).
- WACC Sheet: Pre-configured calculations for the Weighted Average Cost of Capital.
- Editable Inputs: Customize essential drivers such as growth rates, EBITDA percentages, and CAPEX assumptions.
- Quarterly and Annual Statements: A detailed analysis of the financials of Paramount Bed Holdings Co., Ltd. (7817T).
- Interactive Dashboard: A dynamic platform to visualize valuation outcomes and financial projections.
Disclaimer
All information, articles, and product details provided on this website are for general informational and educational purposes only. We do not claim any ownership over, nor do we intend to infringe upon, any trademarks, copyrights, logos, brand names, or other intellectual property mentioned or depicted on this site. Such intellectual property remains the property of its respective owners, and any references here are made solely for identification or informational purposes, without implying any affiliation, endorsement, or partnership.
We make no representations or warranties, express or implied, regarding the accuracy, completeness, or suitability of any content or products presented. Nothing on this website should be construed as legal, tax, investment, financial, medical, or other professional advice. In addition, no part of this site—including articles or product references—constitutes a solicitation, recommendation, endorsement, advertisement, or offer to buy or sell any securities, franchises, or other financial instruments, particularly in jurisdictions where such activity would be unlawful.
All content is of a general nature and may not address the specific circumstances of any individual or entity. It is not a substitute for professional advice or services. Any actions you take based on the information provided here are strictly at your own risk. You accept full responsibility for any decisions or outcomes arising from your use of this website and agree to release us from any liability in connection with your use of, or reliance upon, the content or products found herein.