
|
Maeda Kosen Co., Ltd. (7821.T) DCF Valuation |
Fully Editable: Tailor To Your Needs In Excel Or Sheets
Professional Design: Trusted, Industry-Standard Templates
Investor-Approved Valuation Models
MAC/PC Compatible, Fully Unlocked
No Expertise Is Needed; Easy To Follow
Maeda Kosen Co., Ltd. (7821.T) Bundle
Enhance your investment strategy with the (7821T) DCF Calculator! Utilize real financial data from Maeda Kosen Co., Ltd., adjust growth projections and expenses, and observe how these modifications affect the intrinsic value of (7821T) in real-time.
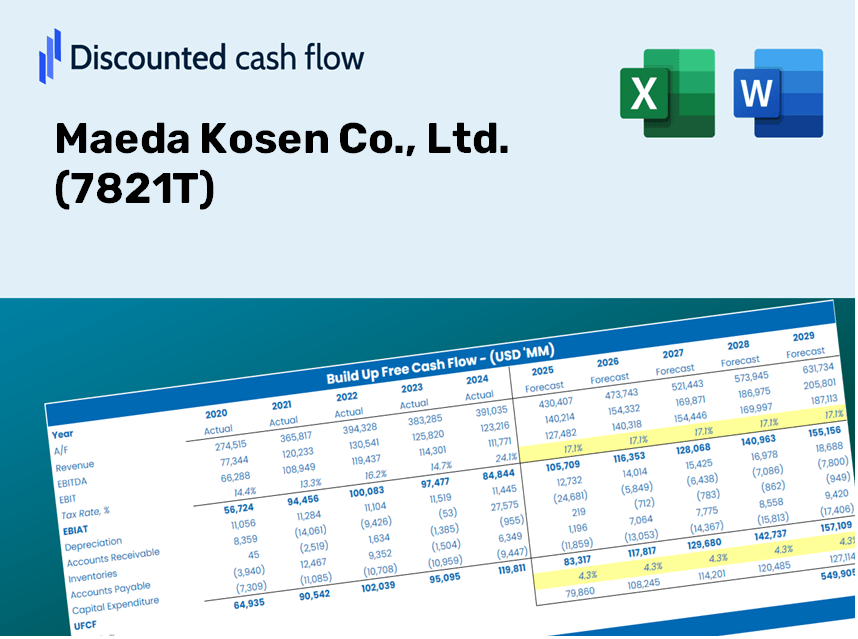
Discounted Cash Flow (DCF) - (USD MM)
| Year | AY1 2021 |
AY2 2022 |
AY3 2023 |
AY4 2024 |
AY5 2025 |
FY1 2026 |
FY2 2027 |
FY3 2028 |
FY4 2029 |
FY5 2030 |
|---|---|---|---|---|---|---|---|---|---|---|
| Revenue | 43,236.0 | 44,281.2 | 50,204.0 | 55,833.0 | 64,108.0 | 70,811.5 | 78,215.9 | 86,394.5 | 95,428.4 | 105,406.9 |
| Revenue Growth, % | 0 | 2.42 | 13.38 | 11.21 | 14.82 | 10.46 | 10.46 | 10.46 | 10.46 | 10.46 |
| EBITDA | 9,568.0 | 8,499.6 | 12,044.0 | 14,740.0 | 16,498.0 | 16,633.5 | 18,372.8 | 20,294.0 | 22,416.0 | 24,759.9 |
| EBITDA, % | 22.13 | 19.19 | 23.99 | 26.4 | 25.73 | 23.49 | 23.49 | 23.49 | 23.49 | 23.49 |
| Depreciation | 3,106.0 | 3,363.6 | 3,188.0 | 3,370.0 | 3,489.0 | 4,618.1 | 5,101.0 | 5,634.3 | 6,223.5 | 6,874.2 |
| Depreciation, % | 7.18 | 7.6 | 6.35 | 6.04 | 5.44 | 6.52 | 6.52 | 6.52 | 6.52 | 6.52 |
| EBIT | 6,462.0 | 5,136.0 | 8,856.0 | 11,370.0 | 13,009.0 | 12,015.4 | 13,271.8 | 14,659.6 | 16,192.5 | 17,885.7 |
| EBIT, % | 14.95 | 11.6 | 17.64 | 20.36 | 20.29 | 16.97 | 16.97 | 16.97 | 16.97 | 16.97 |
| Total Cash | 13,099.0 | 12,808.0 | 14,576.0 | 21,431.0 | 22,270.0 | 22,854.6 | 25,244.4 | 27,884.1 | 30,799.8 | 34,020.4 |
| Total Cash, percent | .0 | .0 | .0 | .0 | .0 | .0 | .0 | .0 | .0 | .0 |
| Account Receivables | 9,411.0 | 11,027.0 | 9,509.0 | 9,314.0 | 10,370.0 | 13,945.2 | 15,403.4 | 17,014.1 | 18,793.1 | 20,758.3 |
| Account Receivables, % | 21.77 | 24.9 | 18.94 | 16.68 | 16.18 | 19.69 | 19.69 | 19.69 | 19.69 | 19.69 |
| Inventories | 8,290.0 | 12,268.0 | 13,661.0 | 14,073.0 | 16,111.0 | 17,621.6 | 19,464.2 | 21,499.5 | 23,747.6 | 26,230.7 |
| Inventories, % | 19.17 | 27.7 | 27.21 | 25.21 | 25.13 | 24.89 | 24.89 | 24.89 | 24.89 | 24.89 |
| Accounts Payable | 1,358.0 | 3,506.0 | 1,835.0 | 1,924.0 | 2,598.0 | 3,145.7 | 3,474.7 | 3,838.0 | 4,239.3 | 4,682.6 |
| Accounts Payable, % | 3.14 | 7.92 | 3.66 | 3.45 | 4.05 | 4.44 | 4.44 | 4.44 | 4.44 | 4.44 |
| Capital Expenditure | -3,058.0 | -4,326.0 | -4,550.0 | -2,952.0 | -2,240.0 | -4,912.4 | -5,426.1 | -5,993.5 | -6,620.2 | -7,312.4 |
| Capital Expenditure, % | -7.07 | -9.77 | -9.06 | -5.29 | -3.49 | -6.94 | -6.94 | -6.94 | -6.94 | -6.94 |
| Tax Rate, % | 26.54 | 26.54 | 26.54 | 26.54 | 26.54 | 26.54 | 26.54 | 26.54 | 26.54 | 26.54 |
| EBITAT | 4,647.9 | 3,844.3 | 6,088.5 | 8,095.1 | 9,556.6 | 8,655.6 | 9,560.6 | 10,560.3 | 11,664.6 | 12,884.3 |
| Depreciation | ||||||||||
| Changes in Account Receivables | ||||||||||
| Changes in Inventories | ||||||||||
| Changes in Accounts Payable | ||||||||||
| Capital Expenditure | ||||||||||
| UFCF | -11,647.1 | -564.1 | 3,180.5 | 8,385.1 | 8,385.6 | 3,823.1 | 6,263.7 | 6,918.6 | 7,642.1 | 8,441.2 |
| WACC, % | 4.48 | 4.48 | 4.47 | 4.48 | 4.48 | 4.48 | 4.48 | 4.48 | 4.48 | 4.48 |
| PV UFCF | ||||||||||
| SUM PV UFCF | 28,658.5 | |||||||||
| Long Term Growth Rate, % | 3.00 | |||||||||
| Free cash flow (T + 1) | 8,694 | |||||||||
| Terminal Value | 588,213 | |||||||||
| Present Terminal Value | 472,507 | |||||||||
| Enterprise Value | 501,165 | |||||||||
| Net Debt | -18,401 | |||||||||
| Equity Value | 519,566 | |||||||||
| Diluted Shares Outstanding, MM | 68 | |||||||||
| Equity Value Per Share | 7,649.11 |
Benefits You Will Receive
- Pre-Filled Financial Model: Utilize Maeda Kosen’s (7821T) actual performance data for accurate DCF valuation.
- Comprehensive Forecast Management: Modify revenue growth, profit margins, WACC, and other essential variables.
- Real-Time Calculations: Automatic updates allow you to view outcomes instantly as you adjust inputs.
- Professional-Grade Template: A polished Excel file crafted for high-quality valuation presentations.
- Adaptable and Reusable: Designed for versatility, enabling repeated application for in-depth forecasts.
Key Features
- Authentic Financial Data: Gain access to precise historical records and future forecasts for Maeda Kosen Co., Ltd. (7821T).
- Adjustable Forecast Parameters: Modify yellow-highlighted fields including WACC, growth rates, and profit margins.
- Real-Time Calculations: Automated updates for DCF, Net Present Value (NPV), and cash flow assessments.
- Interactive Dashboard: User-friendly charts and summaries for a clear visualization of your valuation outcomes.
- Suitable for All Levels: A streamlined, intuitive layout designed for investors, CFOs, and consultants alike.
How It Functions
- Access the Template: Quickly download the Excel-based Maeda Kosen Co., Ltd. ([7821T]) Valuation Model.
- Input Your Variables: Modify the cells highlighted in yellow for growth projections, discount rates, profit margins, and other key metrics.
- Immediate Calculations: The model will automatically refresh to reveal Maeda Kosen’s intrinsic value.
- Explore Scenarios: Experiment with various assumptions to see how they affect the valuation outcome.
- Evaluate and Conclude: Leverage the findings to inform your investment strategy or financial assessment.
Why Choose This Calculator for Maeda Kosen Co., Ltd. (7821T)?
- All-in-One Solution: Features DCF, WACC, and comprehensive financial ratio analysis seamlessly integrated.
- Flexible Inputs: Modify the yellow-highlighted fields to explore different financial scenarios.
- In-Depth Analysis: Automatically computes Maeda Kosen’s intrinsic value and Net Present Value.
- Preloaded Information: Utilizes both historical and projected data for reliable assessments.
- High-Quality Standards: Perfect for financial analysts, investors, and business consultants.
Who Can Benefit from This Product?
- Institutional Investors: Develop comprehensive and accurate valuation models for assessing portfolio performance.
- Corporate Financial Departments: Evaluate valuation scenarios to shape strategic decision-making.
- Financial Advisors and Consultants: Offer clients precise valuation analysis for Maeda Kosen Co., Ltd. (7821T).
- Academics and Students: Utilize contemporary data for hands-on experience in financial modeling and education.
- Industry Enthusiasts: Gain insights into the valuation processes for companies like Maeda Kosen Co., Ltd. (7821T).
Contents of the Template
- Operating and Balance Sheet Data: Pre-filled historical data and forecasts for Maeda Kosen Co., Ltd. (7821T), encompassing revenue, EBITDA, EBIT, and capital expenditures.
- WACC Calculation: A dedicated sheet for calculating the Weighted Average Cost of Capital (WACC), featuring key parameters such as Beta, risk-free rate, and share price.
- DCF Valuation (Unlevered and Levered): Customizable Discounted Cash Flow models that provide intrinsic value calculations with comprehensive breakdowns.
- Financial Statements: Pre-loaded annual and quarterly financial statements to facilitate thorough analysis.
- Key Ratios: Includes essential profitability, leverage, and efficiency ratios specific to Maeda Kosen Co., Ltd. (7821T).
- Dashboard and Charts: A visual overview of valuation outputs and assumptions, allowing for straightforward analysis of results.
Disclaimer
All information, articles, and product details provided on this website are for general informational and educational purposes only. We do not claim any ownership over, nor do we intend to infringe upon, any trademarks, copyrights, logos, brand names, or other intellectual property mentioned or depicted on this site. Such intellectual property remains the property of its respective owners, and any references here are made solely for identification or informational purposes, without implying any affiliation, endorsement, or partnership.
We make no representations or warranties, express or implied, regarding the accuracy, completeness, or suitability of any content or products presented. Nothing on this website should be construed as legal, tax, investment, financial, medical, or other professional advice. In addition, no part of this site—including articles or product references—constitutes a solicitation, recommendation, endorsement, advertisement, or offer to buy or sell any securities, franchises, or other financial instruments, particularly in jurisdictions where such activity would be unlawful.
All content is of a general nature and may not address the specific circumstances of any individual or entity. It is not a substitute for professional advice or services. Any actions you take based on the information provided here are strictly at your own risk. You accept full responsibility for any decisions or outcomes arising from your use of this website and agree to release us from any liability in connection with your use of, or reliance upon, the content or products found herein.