
|
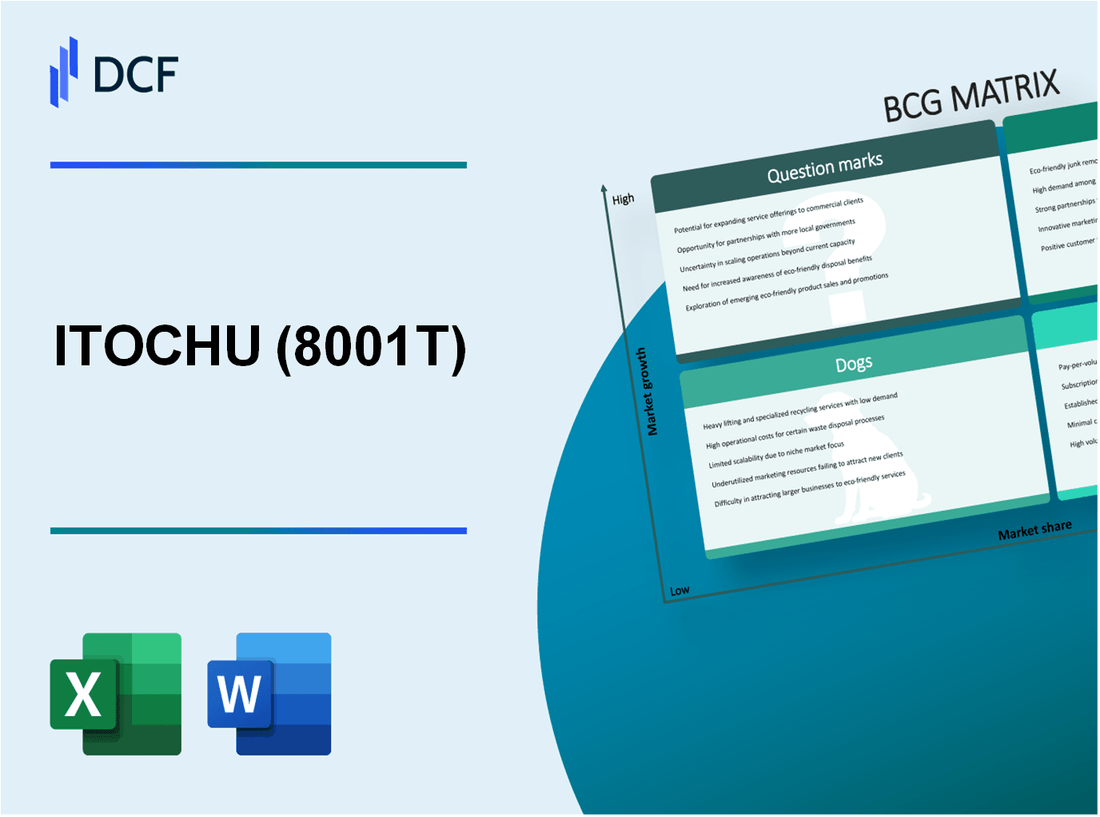
ITOCHU Corporation (8001.T): BCG Matrix |
Fully Editable: Tailor To Your Needs In Excel Or Sheets
Professional Design: Trusted, Industry-Standard Templates
Investor-Approved Valuation Models
MAC/PC Compatible, Fully Unlocked
No Expertise Is Needed; Easy To Follow
ITOCHU Corporation (8001.T) Bundle
The Boston Consulting Group (BCG) Matrix is a powerful tool for analyzing a company's portfolio, and ITOCHU Corporation is no exception. With a diverse range of divisions spread across various industries, understanding which segments are thriving, struggling, or holding potential can offer valuable insights to investors and industry analysts alike. In this post, we delve into ITOCHU's key business areas categorized as Stars, Cash Cows, Dogs, and Question Marks, providing a clear picture of where the company stands in the competitive landscape. Read on to explore the intricacies of ITOCHU's business strategy.
Background of ITOCHU Corporation
Founded in 1858, ITOCHU Corporation stands as one of Japan's leading trading companies. With its headquarters in Tokyo, ITOCHU operates across various sectors including textiles, machinery, and food, among others. The company employs over 40,000 people globally, a testament to its expansive reach and diverse operations.
ITOCHU's business model is rooted in the concept of 'sogo shosha,' which translates to general trading companies. This unique structure allows ITOCHU to engage in a vast array of activities, from import and export to manufacturing and retail, effectively serving as a bridge between Japan and worldwide markets.
In terms of financial performance, for the fiscal year ending March 2023, ITOCHU reported revenues of approximately 12.5 trillion yen (around $115 billion), reflecting a steady growth trajectory. The company has continually adapted to market dynamics, expanding its international operations and investing in emerging sectors such as renewable energy and digital technologies.
ITOCHU's share price has also shown resilience, with a 5-year CAGR (Compound Annual Growth Rate) of approximately 8% as of October 2023, aligning well with its strategic initiatives. The company is listed on the Tokyo Stock Exchange under the ticker symbol 8001.T.
With a robust portfolio and a commitment to innovation, ITOCHU Corporation exemplifies the adaptability and forward-thinking approach necessary for success in today’s complex global markets.
ITOCHU Corporation - BCG Matrix: Stars
Textile Division
The Textile Division of ITOCHU is a prominent player in the textile industry, generating significant revenue. In the fiscal year 2022, this division reported revenues of approximately ¥1.1 trillion (around $10 billion), showcasing its high market share in a growing market.
The division has leveraged its comprehensive supply chain and global sourcing capabilities, allowing it to maintain its competitive edge. ITOCHU's strategic partnerships with leading textile manufacturers have enabled it to capture diverse market segments across various countries.
According to the latest data, the global textile market is expected to grow at a CAGR of 4.4% from 2022 to 2027, which positions ITOCHU's Textile Division favorably for sustained growth in the coming years.
ICT and Finance Solutions Division
ITOCHU's ICT and Finance Solutions Division has demonstrated exceptional growth, contributing significantly to the company's overall market performance. In 2022, revenues from this division reached approximately ¥950 billion (around $8.6 billion), indicating a substantial market share within the rapidly evolving technology sector.
The division focuses on providing innovative financial solutions and ICT services, capitalizing on the increasing demand for digital transformation among businesses. Recent industry reports suggest that the global ICT market is projected to expand with a CAGR of 5.5% from 2023 to 2028, suggesting that ITOCHU's continued investment in this area will enhance its position as a market leader.
Food Company (Food Processing)
In the food processing sector, ITOCHU has established a solid foothold, with its food company reporting revenues of about ¥700 billion (approximately $6.4 billion) in 2022. The division enjoys a significant market share, particularly in Japan, where it serves a wide range of consumer needs.
The global food processing market is expected to grow at a rate of 7.5% annually from 2023 to 2028, driven by increasing health consciousness and demand for processed foods. ITOCHU's strategic investments in sustainable food processing technologies are anticipated to provide operational efficiencies and enhance profitability.
| Division | Revenue (FY 2022) | Market Growth Rate (CAGR) | Market Share Position |
|---|---|---|---|
| Textile Division | ¥1.1 trillion ($10 billion) | 4.4% | High |
| ICT and Finance Solutions Division | ¥950 billion ($8.6 billion) | 5.5% | High |
| Food Company (Food Processing) | ¥700 billion ($6.4 billion) | 7.5% | High |
ITOCHU Corporation's focus on these Star divisions reflects its commitment to expanding market share while investing in high-growth areas. By continually supporting these divisions, ITOCHU is positioning itself to transition these Stars into cash cows in the future.
ITOCHU Corporation - BCG Matrix: Cash Cows
Energy and Chemicals Division
The Energy and Chemicals Division of ITOCHU Corporation benefits from a solid market presence. As of fiscal year 2023, this division generated a revenue of approximately ¥1.1 trillion (about $8 billion), reflecting a stable performance in a mature market.
Key products in this division include petrochemicals, industrial chemicals, and energy trading. The profit margins are robust, with a reported operating margin of around 8%. ITOCHU's relationships with major suppliers and customers enable it to maintain a competitive edge, allowing for relatively minimal investment in promotional activities.
Operational efficiency initiatives have resulted in an increase in cash flow by approximately 5% year-over-year, further solidifying this segment as a cash cow.
Machinery Company (Industrial Machinery)
The Machinery Company segment demonstrates high market share with a diversified product lineup encompassing construction equipment, machine tools, and industrial machinery. In FY 2023, this division reported revenues of about ¥800 billion (approximately $6 billion).
Operating profits in the Machinery Company segment reached ¥80 billion (around $600 million), yielding an operating margin of approximately 10%. The demand for industrial machinery remains steady despite low growth prospects, allowing ITOCHU to focus on efficiency improvements rather than aggressive marketing strategies.
Investment in technology upgrades has led to significant cost reductions, enhancing cash generation by 7% compared to the previous year. Thus, the Machinery Company stands as a vital contributor to ITOCHU's overall profitability.
Metals and Minerals Division
The Metals and Minerals Division is another pillar for ITOCHU, showcasing its strong market positioning. The division achieved revenues of around ¥600 billion (around $4.5 billion) in FY 2023. Key commodities include copper, aluminum, and rare earth materials.
This division boasts an operating margin of about 9%, with profits amounting to approximately ¥54 billion (around $400 million). The low volatility in pricing for these commodities has allowed ITOCHU to maintain a healthy cash flow, while growth rates remain moderate at about 3% annually.
Strategic investments in logistics and supply chain management have further optimized operations, leading to a cash flow increase of approximately 6% over the last fiscal year. This segment effectively supports the company's financial stability.
| Division | FY 2023 Revenue (¥) | Operating Margin (%) | Operating Profit (¥) | Cash Flow Growth (%) |
|---|---|---|---|---|
| Energy and Chemicals | 1.1 trillion | 8% | ¥88 billion | 5% |
| Machinery Company | 800 billion | 10% | ¥80 billion | 7% |
| Metals and Minerals | 600 billion | 9% | ¥54 billion | 6% |
ITOCHU Corporation - BCG Matrix: Dogs
Within ITOCHU Corporation's portfolio, certain product lines fall into the 'Dogs' category, characterized by low market share and low growth potential. Identifying these segments helps in strategic decision-making and resource allocation.
Retail and Apparel Stores
ITOCHU's retail and apparel divisions face significant challenges in the competitive market. The apparel market in Japan was estimated at approximately ¥10 trillion in 2022, with ITOCHU holding a market share of around 3%. Sales growth in this sector has consistently lagged behind consumer expectations, averaging 1.5% annually from 2020 to 2023.
| Metric | Value |
|---|---|
| Market Size (2022) | ¥10 trillion |
| ITOCHU Market Share | 3% |
| Annual Growth Rate | 1.5% |
| Sales Revenue (2022) | ¥300 billion |
Despite diversification within the apparel segment, weak consumer demand has rendered many products ineffective, contributing to their classification as 'Dogs.' The ongoing investment in turnaround strategies has not significantly improved profitability or market share.
Aerospace Products
ITOCHU's aerospace segment, heavily reliant on partnerships with major manufacturers, operates within a global market valued at approximately USD 838 billion as of 2023. However, ITOCHU's share is notably low, estimated at less than 1%. The average growth rate for the aerospace sector is projected at 3% annually, but ITOCHU's aerospace products have struggled to maintain relevance, often seeing stagnant sales.
| Metric | Value |
|---|---|
| Global Market Size (2023) | USD 838 billion |
| ITOCHU Market Share | Less than 1% |
| Annual Growth Rate (Industry) | 3% |
| Annual Sales (2022) | USD 50 million |
The lack of innovation and investment in new technologies has restricted growth potential, pushing the aerospace products into the 'Dogs' category. The financial returns from this segment have not justified the investments made.
Home Appliances
In the home appliances market, ITOCHU competes against established global brands. This market was valued at around ¥3.5 trillion in 2023, with ITOCHU capturing only 2% market share. Growth in this sector has stagnated at approximately 2% annually over the past few years, indicating inadequate performance for ITOCHU's product offerings.
| Metric | Value |
|---|---|
| Market Size (2023) | ¥3.5 trillion |
| ITOCHU Market Share | 2% |
| Annual Growth Rate | 2% |
| Sales Revenue (2022) | ¥60 billion |
The home appliances segment reflects a significant cash trap, with investments yielding minimal returns. The competitive landscape, combined with low consumer interest in ITOCHU's offerings, has led to these products being categorized as 'Dogs.'
ITOCHU Corporation - BCG Matrix: Question Marks
Renewable Energy Investments
ITOCHU Corporation has demonstrated an increasing interest in the renewable energy sector, particularly solar and wind energy projects. As of 2023, the company has invested approximately ¥300 billion (around $2.7 billion) in various renewable energy initiatives worldwide. This investment encompasses solar power generation facilities in Japan and wind power projects in North America.
Despite this significant investment, ITOCHU’s market share in the renewable energy sector remains modest at approximately 3% of the total market, which is valued at an estimated ¥10 trillion (approximately $90 billion) in Japan alone. The company's strategy aims to boost market penetration by leveraging partnerships and joint ventures.
Healthcare Sector Initiatives
In the healthcare sector, ITOCHU has embarked on several initiatives, focusing on medical devices and health technology solutions. For the fiscal year 2023, the healthcare division recorded revenues of ¥50 billion (approximately $450 million), reflecting a growth rate of 12% year-over-year.
However, ITOCHU’s share in this rapidly growing market is estimated at only 2%, which positions its healthcare initiatives as Question Marks within the BCG Matrix. The global healthcare market is projected to reach $11 trillion by 2027, providing substantial growth potential. To capitalize on this, ITOCHU is expected to increase its investment in research and development by 20% in the next fiscal year.
Biotechnology Ventures
ITOCHU has made strategic moves into biotechnology, particularly in biopharmaceuticals and agricultural biotechnology sectors. As of 2023, its biotechnology investments have totaled around ¥80 billion (approximately $720 million). Nevertheless, the company holds a market share of just 1.5% in the highly competitive biotechnology space, which is valued at approximately $1.5 trillion globally.
The following table outlines ITOCHU's investment in various sectors and their corresponding market shares:
| Sector | Investment (¥ billion) | Investment (USD billion) | Market Share (%) | Market Size (¥ trillion) | Market Size (USD trillion) |
|---|---|---|---|---|---|
| Renewable Energy | 300 | 2.7 | 3 | 10 | 90 |
| Healthcare | 50 | 0.45 | 2 | 11 | 99 |
| Biotechnology | 80 | 0.72 | 1.5 | 1.5 | 13.5 |
These sectors present a high-growth environment but require ITOCHU to allocate substantial resources for marketing and product development to capture greater market share. Without decisive action, these Question Marks risk becoming Dogs, consuming more resources than they generate in revenue.
In the dynamic landscape of ITOCHU Corporation's business segments, the BCG Matrix reveals a fascinating interplay between growth potential and market share, highlighting how the company is strategically positioned across its diverse divisions. With promising Stars leading the way and potential Question Marks suggesting new avenues for expansion, ITOCHU's diversified portfolio not only demonstrates resilience but also emphasizes the importance of informed investment decisions in an ever-evolving market.
[right_small]Disclaimer
All information, articles, and product details provided on this website are for general informational and educational purposes only. We do not claim any ownership over, nor do we intend to infringe upon, any trademarks, copyrights, logos, brand names, or other intellectual property mentioned or depicted on this site. Such intellectual property remains the property of its respective owners, and any references here are made solely for identification or informational purposes, without implying any affiliation, endorsement, or partnership.
We make no representations or warranties, express or implied, regarding the accuracy, completeness, or suitability of any content or products presented. Nothing on this website should be construed as legal, tax, investment, financial, medical, or other professional advice. In addition, no part of this site—including articles or product references—constitutes a solicitation, recommendation, endorsement, advertisement, or offer to buy or sell any securities, franchises, or other financial instruments, particularly in jurisdictions where such activity would be unlawful.
All content is of a general nature and may not address the specific circumstances of any individual or entity. It is not a substitute for professional advice or services. Any actions you take based on the information provided here are strictly at your own risk. You accept full responsibility for any decisions or outcomes arising from your use of this website and agree to release us from any liability in connection with your use of, or reliance upon, the content or products found herein.