
|
Goldwin Inc. (8111.T) DCF Valuation |
Fully Editable: Tailor To Your Needs In Excel Or Sheets
Professional Design: Trusted, Industry-Standard Templates
Investor-Approved Valuation Models
MAC/PC Compatible, Fully Unlocked
No Expertise Is Needed; Easy To Follow
Goldwin Inc. (8111.T) Bundle
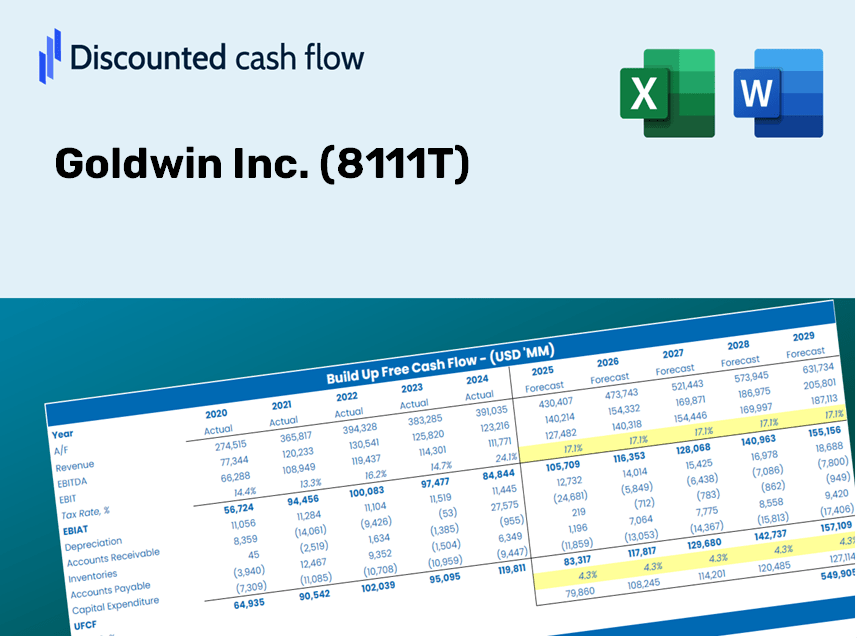
As an investor or analyst, the Goldwin Inc. (8111T) DCF Calculator serves as your essential resource for accurate valuation. Filled with real data from Goldwin Inc., you can adjust forecasts and observe the effects in real time.
Discounted Cash Flow (DCF) - (USD MM)
| Year | AY1 2020 |
AY2 2021 |
AY3 2022 |
AY4 2023 |
AY5 2024 |
FY1 2025 |
FY2 2026 |
FY3 2027 |
FY4 2028 |
FY5 2029 |
|---|---|---|---|---|---|---|---|---|---|---|
| Revenue | 90,462.0 | 98,235.0 | 115,052.0 | 126,907.0 | 132,305.0 | 145,624.6 | 160,285.0 | 176,421.4 | 194,182.3 | 213,731.3 |
| Revenue Growth, % | 0 | 8.59 | 17.12 | 10.3 | 4.25 | 10.07 | 10.07 | 10.07 | 10.07 | 10.07 |
| EBITDA | 17,359.0 | 21,862.0 | 29,701.0 | 34,634.0 | 32,560.0 | 34,705.2 | 38,199.1 | 42,044.8 | 46,277.5 | 50,936.4 |
| EBITDA, % | 19.19 | 22.25 | 25.82 | 27.29 | 24.61 | 23.83 | 23.83 | 23.83 | 23.83 | 23.83 |
| Depreciation | 1,669.0 | 1,646.0 | 1,762.0 | 2,046.0 | 2,299.0 | 2,447.0 | 2,693.4 | 2,964.5 | 3,263.0 | 3,591.5 |
| Depreciation, % | 1.84 | 1.68 | 1.53 | 1.61 | 1.74 | 1.68 | 1.68 | 1.68 | 1.68 | 1.68 |
| EBIT | 15,690.0 | 20,216.0 | 27,939.0 | 32,588.0 | 30,261.0 | 32,258.2 | 35,505.7 | 39,080.2 | 43,014.5 | 47,345.0 |
| EBIT, % | 17.34 | 20.58 | 24.28 | 25.68 | 22.87 | 22.15 | 22.15 | 22.15 | 22.15 | 22.15 |
| Total Cash | 21,536.0 | 26,406.0 | 35,654.0 | 43,479.0 | 52,526.0 | 45,329.4 | 49,892.8 | 54,915.7 | 60,444.2 | 66,529.3 |
| Total Cash, percent | .0 | .0 | .0 | .0 | .0 | .0 | .0 | .0 | .0 | .0 |
| Account Receivables | 12,446.0 | 13,816.0 | 16,289.0 | 20,449.0 | 19,533.0 | 21,219.7 | 23,355.9 | 25,707.2 | 28,295.3 | 31,143.8 |
| Account Receivables, % | 13.76 | 14.06 | 14.16 | 16.11 | 14.76 | 14.57 | 14.57 | 14.57 | 14.57 | 14.57 |
| Inventories | 15,152.0 | 13,422.0 | 14,627.0 | 18,216.0 | 19,218.0 | 20,971.5 | 23,082.8 | 25,406.6 | 27,964.4 | 30,779.6 |
| Inventories, % | 16.75 | 13.66 | 12.71 | 14.35 | 14.53 | 14.4 | 14.4 | 14.4 | 14.4 | 14.4 |
| Accounts Payable | 3,544.0 | 8,691.0 | 9,195.0 | 7,411.0 | 20,209.0 | 12,194.9 | 13,422.6 | 14,773.9 | 16,261.3 | 17,898.3 |
| Accounts Payable, % | 3.92 | 8.85 | 7.99 | 5.84 | 15.27 | 8.37 | 8.37 | 8.37 | 8.37 | 8.37 |
| Capital Expenditure | -3,195.0 | -1,722.0 | -1,770.0 | -1,994.0 | -2,007.0 | -2,886.7 | -3,177.3 | -3,497.2 | -3,849.2 | -4,236.8 |
| Capital Expenditure, % | -3.53 | -1.75 | -1.54 | -1.57 | -1.52 | -1.98 | -1.98 | -1.98 | -1.98 | -1.98 |
| Tax Rate, % | 19.11 | 19.11 | 19.11 | 19.11 | 19.11 | 19.11 | 19.11 | 19.11 | 19.11 | 19.11 |
| EBITAT | 10,825.8 | 14,410.6 | 21,012.3 | 24,307.9 | 24,478.8 | 23,933.8 | 26,343.3 | 28,995.4 | 31,914.4 | 35,127.4 |
| Depreciation | ||||||||||
| Changes in Account Receivables | ||||||||||
| Changes in Inventories | ||||||||||
| Changes in Accounts Payable | ||||||||||
| Capital Expenditure | ||||||||||
| UFCF | -14,754.2 | 19,841.6 | 17,830.3 | 14,826.9 | 37,482.8 | 12,039.9 | 22,839.6 | 25,138.9 | 27,669.7 | 30,455.3 |
| WACC, % | 4.97 | 4.97 | 4.97 | 4.97 | 4.98 | 4.97 | 4.97 | 4.97 | 4.97 | 4.97 |
| PV UFCF | ||||||||||
| SUM PV UFCF | 100,606.8 | |||||||||
| Long Term Growth Rate, % | 3.00 | |||||||||
| Free cash flow (T + 1) | 31,369 | |||||||||
| Terminal Value | 1,589,163 | |||||||||
| Present Terminal Value | 1,246,698 | |||||||||
| Enterprise Value | 1,347,305 | |||||||||
| Net Debt | -49,897 | |||||||||
| Equity Value | 1,397,202 | |||||||||
| Diluted Shares Outstanding, MM | 134 | |||||||||
| Equity Value Per Share | 10,402.35 |
What You Will Receive
- Adjustable Projection Inputs: Seamlessly modify key assumptions (growth %, profit margins, WACC) to explore various scenarios.
- Comprehensive Market Data: Goldwin Inc.'s (8111T) financial metrics pre-loaded to enhance your analysis.
- Automated DCF Calculations: The template computes Net Present Value (NPV) and intrinsic value automatically.
- Tailorable and Professional Design: A refined Excel model that aligns with your valuation requirements.
- Designed for Analysts and Investors: Perfect for evaluating forecasts, affirming strategies, and optimizing your time.
Key Features
- Customizable Forecast Inputs: Adjust essential metrics such as revenue growth, EBITDA %, and capital expenditures for your analysis.
- Instant DCF Valuation: Provides quick calculations of intrinsic value, NPV, and more at the click of a button.
- High-Precision Accuracy: Leverages Goldwin Inc.’s (8111T) actual financial data for reliable valuation insights.
- Effortless Scenario Analysis: Easily test various assumptions and evaluate different outcomes without hassle.
- Efficiency Booster: Save time by avoiding the creation of intricate valuation models from the ground up.
How It Works
- Step 1: Download the prebuilt Excel template featuring Goldwin Inc.'s (8111T) data.
- Step 2: Review the populated sheets to familiarize yourself with the essential metrics.
- Step 3: Adjust forecasts and assumptions in the editable yellow cells (WACC, growth rates, margins).
- Step 4: Instantly see the recalculated results, which include the intrinsic value of Goldwin Inc. (8111T).
- Step 5: Utilize the outputs to make informed investment decisions or to create comprehensive reports.
Why Choose This Calculator for Goldwin Inc. (8111T)?
- User-Friendly: Crafted for both novices and seasoned professionals.
- Customizable Inputs: Effortlessly adjust parameters to suit your analysis.
- Real-Time Adjustments: Observe immediate changes to Goldwin’s valuation as you modify inputs.
- Pre-Configured: Comes with Goldwin’s latest financial data for fast analysis.
- Relied Upon by Experts: A go-to resource for investors and analysts making strategic decisions.
Who Can Benefit from Goldwin Inc. (8111T)?
- Finance Students: Discover valuation methodologies and practice them with actual market data.
- Academics: Utilize professional valuation models for your teaching or research endeavors.
- Investors: Evaluate your hypotheses and assess the valuation results for Goldwin Inc. (8111T).
- Analysts: Enhance your efficiency with a customizable, ready-to-use DCF model.
- Small Business Owners: Understand how large publicly traded companies like Goldwin Inc. (8111T) are appraised.
Contents of the Template
- Pre-Filled Data: Features Goldwin Inc.’s historical financials and projections.
- Discounted Cash Flow Model: A customizable DCF valuation model with automatic calculations.
- Weighted Average Cost of Capital (WACC): A specific sheet for calculating WACC based on user-defined inputs.
- Key Financial Ratios: Evaluate Goldwin Inc.’s profitability, efficiency, and financial leverage.
- Customizable Inputs: Adjust revenue growth, profit margins, and tax rates effortlessly.
- Clear Dashboard: Visual representations, including charts and tables, summarizing essential valuation outcomes.
Disclaimer
All information, articles, and product details provided on this website are for general informational and educational purposes only. We do not claim any ownership over, nor do we intend to infringe upon, any trademarks, copyrights, logos, brand names, or other intellectual property mentioned or depicted on this site. Such intellectual property remains the property of its respective owners, and any references here are made solely for identification or informational purposes, without implying any affiliation, endorsement, or partnership.
We make no representations or warranties, express or implied, regarding the accuracy, completeness, or suitability of any content or products presented. Nothing on this website should be construed as legal, tax, investment, financial, medical, or other professional advice. In addition, no part of this site—including articles or product references—constitutes a solicitation, recommendation, endorsement, advertisement, or offer to buy or sell any securities, franchises, or other financial instruments, particularly in jurisdictions where such activity would be unlawful.
All content is of a general nature and may not address the specific circumstances of any individual or entity. It is not a substitute for professional advice or services. Any actions you take based on the information provided here are strictly at your own risk. You accept full responsibility for any decisions or outcomes arising from your use of this website and agree to release us from any liability in connection with your use of, or reliance upon, the content or products found herein.