
|
Unicharm Corporation (8113.T) DCF Valuation |
Fully Editable: Tailor To Your Needs In Excel Or Sheets
Professional Design: Trusted, Industry-Standard Templates
Investor-Approved Valuation Models
MAC/PC Compatible, Fully Unlocked
No Expertise Is Needed; Easy To Follow
Unicharm Corporation (8113.T) Bundle
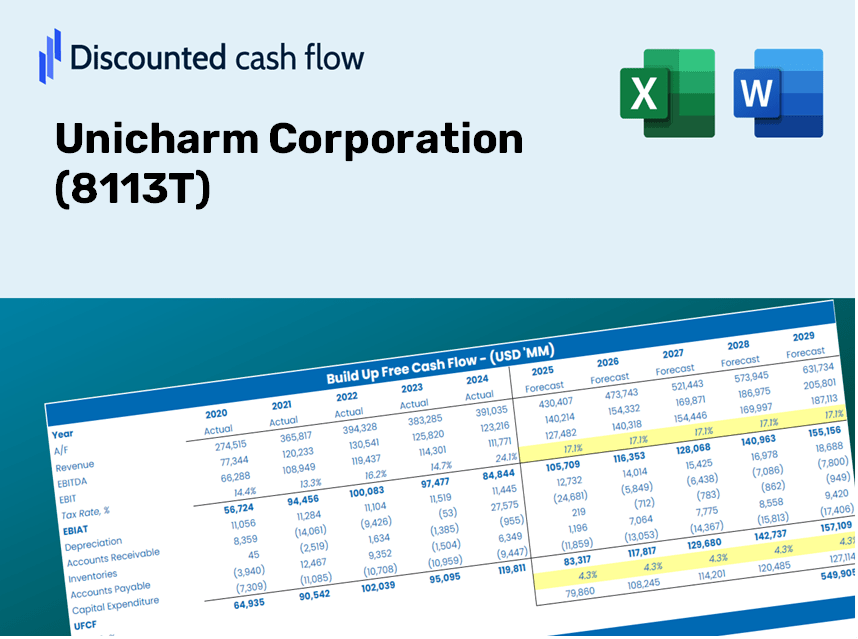
Looking to assess the intrinsic value of Unicharm Corporation? Our (8113T) DCF Calculator integrates real-world data with comprehensive customization options, enabling you to refine your forecasts and enhance your investment choices.
What You Will Receive
- Authentic Unicharm Data: Preloaded financial metrics – encompassing revenue to EBIT – grounded in actual and projected figures.
- Comprehensive Customization: Modify all essential parameters (yellow cells) such as WACC, growth %, and tax rates.
- Immediate Valuation Updates: Automatic recalculations to evaluate the effects of adjustments on Unicharm’s fair value.
- Flexible Excel Template: Designed for quick modifications, scenario analysis, and in-depth forecasting.
- Efficient and Precise: Avoid the hassle of constructing models from the beginning while ensuring accuracy and adaptability.
Key Features
- Comprehensive DCF Calculator: Offers detailed unlevered and levered DCF valuation models tailored for Unicharm Corporation (8113T).
- WACC Calculator: Pre-loaded Weighted Average Cost of Capital sheet with adjustable input parameters.
- Customizable Forecast Assumptions: Easily alter growth rates, capital expenditures, and discount rates for precise modeling.
- Integrated Financial Ratios: Assess profitability, leverage, and efficiency ratios specifically for Unicharm Corporation (8113T).
- Interactive Dashboard and Charts: Visual representations summarize essential valuation metrics for streamlined analysis.
How It Works
- Step 1: Download the Excel file for Unicharm Corporation (8113T).
- Step 2: Review the pre-filled financial data and forecasts provided for Unicharm Corporation (8113T).
- Step 3: Adjust key inputs such as revenue growth, WACC, and tax rates (highlighted cells) for Unicharm Corporation (8113T).
- Step 4: Observe the DCF model update in real-time as you modify your assumptions for Unicharm Corporation (8113T).
- Step 5: Evaluate the outputs and leverage the results for your investment decisions regarding Unicharm Corporation (8113T).
Why Choose This Calculator for Unicharm Corporation (8113T)?
- All-in-One Solution: Features DCF, WACC, and financial ratio analyses for a comprehensive evaluation.
- Flexible Settings: Modify the yellow-highlighted cells to explore different financial scenarios.
- In-Depth Analysis: Automatically computes Unicharm's intrinsic value and Net Present Value.
- Curated Data: Historical and projected data provide reliable starting points.
- Expert-Grade Tool: Perfect for financial analysts, investors, and business consultants.
Who Should Consider Using This Product?
- Finance Students: Master valuation techniques and apply them using real market data focused on Unicharm Corporation (8113T).
- Academics: Integrate professional valuation models into your curriculum or research efforts related to Unicharm Corporation (8113T).
- Investors: Challenge your investment assumptions and analyze valuation outcomes for Unicharm Corporation (8113T).
- Analysts: Enhance your analysis process with a customizable DCF model specifically designed for Unicharm Corporation (8113T).
- Small Business Owners: Discover how major public companies, like Unicharm Corporation (8113T), are evaluated in the market.
Contents of the Template
- In-Depth DCF Model: An editable template featuring comprehensive valuation calculations.
- Real-World Data: Historical and projected financials for Unicharm Corporation (8113T) preloaded for your analysis.
- Customizable Parameters: Modify WACC, growth rates, and tax assumptions to explore various scenarios.
- Financial Statements: Complete annual and quarterly breakdowns for enhanced insights.
- Key Ratios: Integrated analysis for assessing profitability, efficiency, and leverage.
- Dashboard with Visual Outputs: Includes charts and tables to present clear, actionable results.
Disclaimer
All information, articles, and product details provided on this website are for general informational and educational purposes only. We do not claim any ownership over, nor do we intend to infringe upon, any trademarks, copyrights, logos, brand names, or other intellectual property mentioned or depicted on this site. Such intellectual property remains the property of its respective owners, and any references here are made solely for identification or informational purposes, without implying any affiliation, endorsement, or partnership.
We make no representations or warranties, express or implied, regarding the accuracy, completeness, or suitability of any content or products presented. Nothing on this website should be construed as legal, tax, investment, financial, medical, or other professional advice. In addition, no part of this site—including articles or product references—constitutes a solicitation, recommendation, endorsement, advertisement, or offer to buy or sell any securities, franchises, or other financial instruments, particularly in jurisdictions where such activity would be unlawful.
All content is of a general nature and may not address the specific circumstances of any individual or entity. It is not a substitute for professional advice or services. Any actions you take based on the information provided here are strictly at your own risk. You accept full responsibility for any decisions or outcomes arising from your use of this website and agree to release us from any liability in connection with your use of, or reliance upon, the content or products found herein.