
|
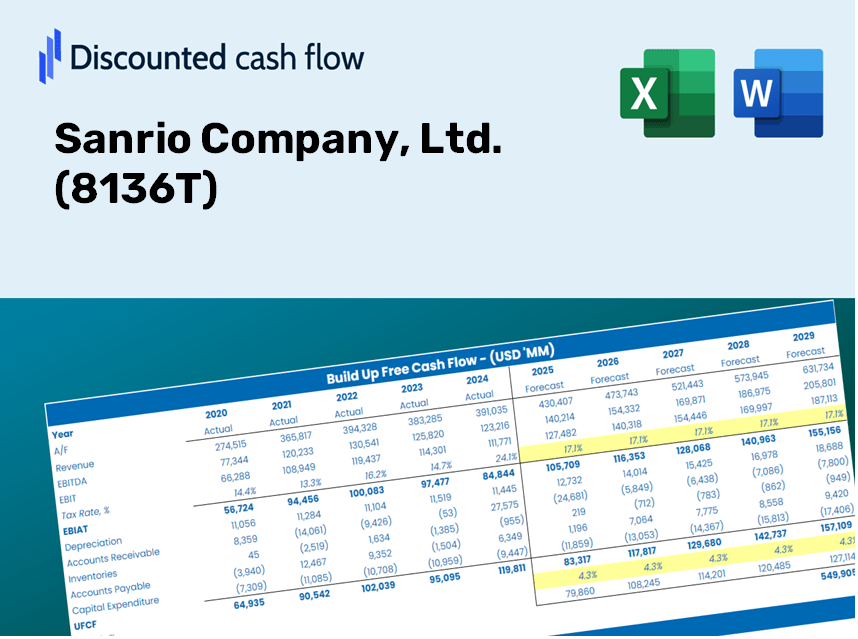
Sanrio Company, Ltd. (8136.T) DCF Valuation |
Fully Editable: Tailor To Your Needs In Excel Or Sheets
Professional Design: Trusted, Industry-Standard Templates
Investor-Approved Valuation Models
MAC/PC Compatible, Fully Unlocked
No Expertise Is Needed; Easy To Follow
Sanrio Company, Ltd. (8136.T) Bundle
Save time and improve precision with our (8136T) DCF Calculator! Equipped with real Sanrio Company data and customizable assumptions, this tool enables you to forecast, analyze, and evaluate Sanrio like a seasoned investor.
Discounted Cash Flow (DCF) - (USD MM)
| Year | AY1 2021 |
AY2 2022 |
AY3 2023 |
AY4 2024 |
AY5 2025 |
FY1 2026 |
FY2 2027 |
FY3 2028 |
FY4 2029 |
FY5 2030 |
|---|---|---|---|---|---|---|---|---|---|---|
| Revenue | 41,070.0 | 52,763.0 | 72,624.0 | 99,981.0 | 144,904.0 | 198,777.0 | 272,679.2 | 374,057.0 | 513,125.6 | 703,897.6 |
| Revenue Growth, % | 0 | 28.47 | 37.64 | 37.67 | 44.93 | 37.18 | 37.18 | 37.18 | 37.18 | 37.18 |
| EBITDA | -694.0 | 6,814.0 | 15,417.0 | 30,783.0 | 57,988.0 | 41,051.5 | 56,313.8 | 77,250.4 | 105,970.8 | 145,369.1 |
| EBITDA, % | -1.69 | 12.91 | 21.23 | 30.79 | 40.02 | 20.65 | 20.65 | 20.65 | 20.65 | 20.65 |
| Depreciation | 1,846.0 | 1,699.0 | 1,958.0 | 1,967.0 | 2,383.0 | 5,574.8 | 7,647.5 | 10,490.7 | 14,390.9 | 19,741.3 |
| Depreciation, % | 4.49 | 3.22 | 2.7 | 1.97 | 1.64 | 2.8 | 2.8 | 2.8 | 2.8 | 2.8 |
| EBIT | -2,540.0 | 5,115.0 | 13,459.0 | 28,816.0 | 55,605.0 | 35,476.7 | 48,666.3 | 66,759.7 | 91,579.9 | 125,627.9 |
| EBIT, % | -6.18 | 9.69 | 18.53 | 28.82 | 38.37 | 17.85 | 17.85 | 17.85 | 17.85 | 17.85 |
| Total Cash | 36,876.0 | 38,404.0 | 52,008.0 | 90,442.0 | 118,976.0 | 161,706.2 | 221,826.0 | 304,297.4 | 417,430.4 | 572,624.5 |
| Total Cash, percent | .0 | .0 | .0 | .0 | .0 | .0 | .0 | .0 | .0 | .0 |
| Account Receivables | 7,894.0 | 6,172.0 | 9,146.0 | 14,459.0 | 22,769.0 | 29,294.6 | 40,185.8 | 55,126.3 | 75,621.3 | 103,736.2 |
| Account Receivables, % | 19.22 | 11.7 | 12.59 | 14.46 | 15.71 | 14.74 | 14.74 | 14.74 | 14.74 | 14.74 |
| Inventories | 4,606.0 | 3,531.0 | 4,541.0 | 6,454.0 | 7,739.0 | 14,294.4 | 19,608.9 | 26,899.2 | 36,899.8 | 50,618.6 |
| Inventories, % | 11.21 | 6.69 | 6.25 | 6.46 | 5.34 | 7.19 | 7.19 | 7.19 | 7.19 | 7.19 |
| Accounts Payable | 3,180.0 | 3,797.0 | 4,074.0 | 4,882.0 | 5,420.0 | 11,597.6 | 15,909.3 | 21,824.2 | 29,938.1 | 41,068.6 |
| Accounts Payable, % | 7.74 | 7.2 | 5.61 | 4.88 | 3.74 | 5.83 | 5.83 | 5.83 | 5.83 | 5.83 |
| Capital Expenditure | -1,053.0 | -715.0 | -1,005.0 | -2,339.0 | -2,459.0 | -3,712.9 | -5,093.3 | -6,986.9 | -9,584.5 | -13,147.8 |
| Capital Expenditure, % | -2.56 | -1.36 | -1.38 | -2.34 | -1.7 | -1.87 | -1.87 | -1.87 | -1.87 | -1.87 |
| Tax Rate, % | 24.72 | 24.72 | 24.72 | 24.72 | 24.72 | 24.72 | 24.72 | 24.72 | 24.72 | 24.72 |
| EBITAT | -3,758.7 | 3,539.2 | 8,264.2 | 17,695.8 | 41,858.2 | 26,060.0 | 35,748.7 | 49,039.5 | 67,271.6 | 92,282.2 |
| Depreciation | ||||||||||
| Changes in Account Receivables | ||||||||||
| Changes in Inventories | ||||||||||
| Changes in Accounts Payable | ||||||||||
| Capital Expenditure | ||||||||||
| UFCF | -12,285.7 | 7,937.2 | 5,510.2 | 10,905.8 | 32,725.2 | 21,018.5 | 26,409.0 | 36,227.4 | 49,696.2 | 68,172.5 |
| WACC, % | 4.65 | 4.61 | 4.6 | 4.6 | 4.62 | 4.62 | 4.62 | 4.62 | 4.62 | 4.62 |
| PV UFCF | ||||||||||
| SUM PV UFCF | 171,732.0 | |||||||||
| Long Term Growth Rate, % | 3.30 | |||||||||
| Free cash flow (T + 1) | 70,422 | |||||||||
| Terminal Value | 5,336,621 | |||||||||
| Present Terminal Value | 4,257,955 | |||||||||
| Enterprise Value | 4,429,687 | |||||||||
| Net Debt | -72,594 | |||||||||
| Equity Value | 4,502,281 | |||||||||
| Diluted Shares Outstanding, MM | 247 | |||||||||
| Equity Value Per Share | 18,225.79 |
What You Will Receive
- Pre-Populated Financial Model: Utilizing Sanrio's actual data for accurate DCF valuation.
- Comprehensive Forecast Control: Modify revenue growth, profit margins, WACC, and other critical parameters.
- Real-Time Calculations: Immediate updates allow you to view results as you implement changes.
- Investor-Ready Template: A polished Excel document specifically crafted for high-quality valuation.
- Adaptable and Reusable: Designed for versatility, enabling repeated use for in-depth forecasts.
Key Features
- Pre-Loaded Data: Sanrio's historical financial statements and pre-filled forecasts.
- Fully Adjustable Inputs: Customize WACC, tax rates, revenue growth, and EBITDA margins as needed.
- Instant Results: Watch Sanrio's intrinsic value update in real time.
- Clear Visual Outputs: Interactive dashboard charts present valuation results and essential metrics.
- Built for Accuracy: A professional-grade tool designed for analysts, investors, and finance professionals.
How It Works
- Step 1: Download the prebuilt Excel template featuring Sanrio Company's data.
- Step 2: Navigate through the pre-filled sheets to familiarize yourself with the key metrics.
- Step 3: Modify forecasts and assumptions in the editable yellow cells (WACC, growth, margins).
- Step 4: Quickly view the recalculated results, including Sanrio's intrinsic value.
- Step 5: Make well-informed investment choices or create reports based on the outputs.
Why Opt for This Calculator?
- Designed for Experts: A sophisticated tool tailored for analysts, CFOs, and consultants.
- Live Financial Data: Sanrio’s historical and projected financials are pre-loaded for enhanced accuracy.
- Forecast Simulation: Effortlessly explore various scenarios and assumptions.
- Clear Results: Automatically computes intrinsic value, NPV, and other essential metrics.
- User-Friendly: Comprehensive step-by-step instructions make the process straightforward.
Who Can Benefit from This Product?
- Professional Investors: Develop precise and trustworthy valuation models for analyzing portfolios featuring Sanrio Company, Ltd. (8136T).
- Corporate Finance Teams: Evaluate valuation scenarios to inform strategic decisions within the organization.
- Consultants and Advisors: Deliver clients accurate valuation analyses for Sanrio Company, Ltd. (8136T) stock.
- Students and Educators: Utilize actual data to practice and educate on financial modeling techniques.
- Anime and Pop Culture Enthusiasts: Gain insights into how companies like Sanrio Company, Ltd. (8136T) are valued in the industry.
Contents of the Template
- Operating and Balance Sheet Data: Pre-filled historical data and forecasts for Sanrio Company, Ltd. (8136T), covering revenue, EBITDA, EBIT, and capital expenditures.
- WACC Calculation: A dedicated sheet for calculating the Weighted Average Cost of Capital (WACC), including essential parameters such as Beta, risk-free rate, and share price.
- DCF Valuation (Unlevered and Levered): Customizable Discounted Cash Flow models displaying intrinsic value with comprehensive calculations.
- Financial Statements: Pre-loaded annual and quarterly financial statements to aid in thorough analysis.
- Key Ratios: Features profitability, leverage, and efficiency ratios specific to Sanrio Company, Ltd. (8136T).
- Dashboard and Charts: A visual representation of valuation outputs and key assumptions for easy result analysis.
Disclaimer
All information, articles, and product details provided on this website are for general informational and educational purposes only. We do not claim any ownership over, nor do we intend to infringe upon, any trademarks, copyrights, logos, brand names, or other intellectual property mentioned or depicted on this site. Such intellectual property remains the property of its respective owners, and any references here are made solely for identification or informational purposes, without implying any affiliation, endorsement, or partnership.
We make no representations or warranties, express or implied, regarding the accuracy, completeness, or suitability of any content or products presented. Nothing on this website should be construed as legal, tax, investment, financial, medical, or other professional advice. In addition, no part of this site—including articles or product references—constitutes a solicitation, recommendation, endorsement, advertisement, or offer to buy or sell any securities, franchises, or other financial instruments, particularly in jurisdictions where such activity would be unlawful.
All content is of a general nature and may not address the specific circumstances of any individual or entity. It is not a substitute for professional advice or services. Any actions you take based on the information provided here are strictly at your own risk. You accept full responsibility for any decisions or outcomes arising from your use of this website and agree to release us from any liability in connection with your use of, or reliance upon, the content or products found herein.