
|
Tokyo Century Corporation (8439.T) DCF Valuation |
Fully Editable: Tailor To Your Needs In Excel Or Sheets
Professional Design: Trusted, Industry-Standard Templates
Investor-Approved Valuation Models
MAC/PC Compatible, Fully Unlocked
No Expertise Is Needed; Easy To Follow
Tokyo Century Corporation (8439.T) Bundle
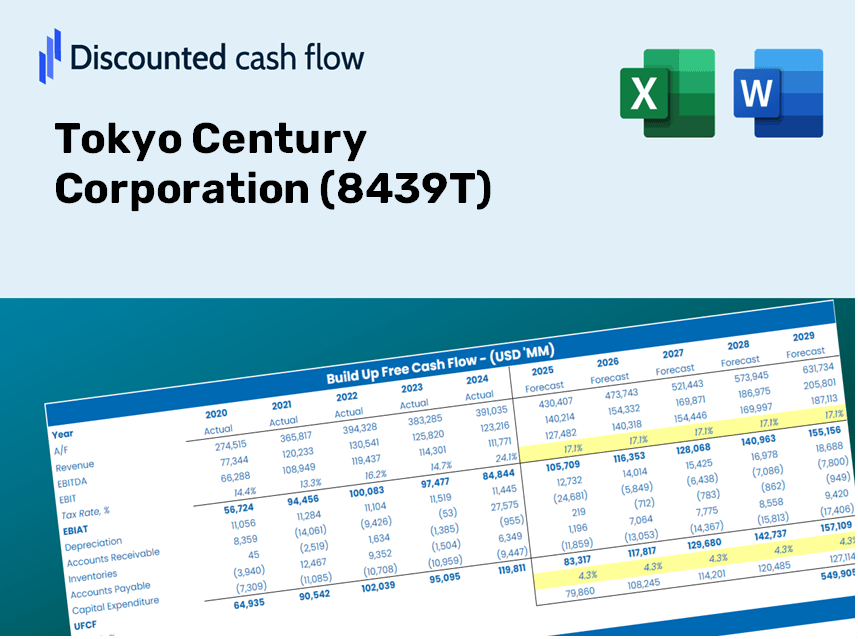
Simplify Tokyo Century Corporation (8439T) valuation with this customizable DCF Calculator! Featuring real Tokyo Century Corporation (8439T) financials and adjustable forecast inputs, you can test scenarios and uncover Tokyo Century Corporation (8439T) fair value in minutes.
Discounted Cash Flow (DCF) - (USD MM)
| Year | AY1 2021 |
AY2 2022 |
AY3 2023 |
AY4 2024 |
AY5 2025 |
FY1 2026 |
FY2 2027 |
FY3 2028 |
FY4 2029 |
FY5 2030 |
|---|---|---|---|---|---|---|---|---|---|---|
| Revenue | 1,200,184.0 | 1,277,976.0 | 1,324,962.0 | 1,346,113.0 | 1,368,635.0 | 1,414,579.1 | 1,462,065.6 | 1,511,146.2 | 1,561,874.3 | 1,614,305.4 |
| Revenue Growth, % | 0 | 6.48 | 3.68 | 1.6 | 1.67 | 3.36 | 3.36 | 3.36 | 3.36 | 3.36 |
| EBITDA | 271,850.0 | 286,181.0 | 319,044.0 | 350,963.0 | 383,274.0 | 348,552.1 | 360,252.7 | 372,346.1 | 384,845.6 | 397,764.6 |
| EBITDA, % | 22.65 | 22.39 | 24.08 | 26.07 | 28 | 24.64 | 24.64 | 24.64 | 24.64 | 24.64 |
| Depreciation | 194,695.0 | 203,505.0 | 227,822.0 | 246,736.0 | 266,213.0 | 246,479.7 | 254,753.9 | 263,305.8 | 272,144.8 | 281,280.5 |
| Depreciation, % | 16.22 | 15.92 | 17.19 | 18.33 | 19.45 | 17.42 | 17.42 | 17.42 | 17.42 | 17.42 |
| EBIT | 77,155.0 | 82,676.0 | 91,222.0 | 104,227.0 | 117,061.0 | 102,072.4 | 105,498.9 | 109,040.4 | 112,700.8 | 116,484.1 |
| EBIT, % | 6.43 | 6.47 | 6.88 | 7.74 | 8.55 | 7.22 | 7.22 | 7.22 | 7.22 | 7.22 |
| Total Cash | 530,665.0 | 593,294.0 | 542,779.0 | 601,718.0 | 598,356.0 | 622,485.6 | 643,382.0 | 664,979.9 | 687,302.9 | 710,375.2 |
| Total Cash, percent | .0 | .0 | .0 | .0 | .0 | .0 | .0 | .0 | .0 | .0 |
| Account Receivables | 2,634,981.0 | 2,213,716.0 | 2,251,979.0 | 686,826.0 | 2,154,148.0 | 1,276,015.2 | 1,318,850.2 | 1,363,123.1 | 1,408,882.2 | 1,456,177.4 |
| Account Receivables, % | 219.55 | 173.22 | 169.97 | 51.02 | 157.39 | 90.2 | 90.2 | 90.2 | 90.2 | 90.2 |
| Inventories | 10,472.0 | 13,341.0 | 28,147.0 | 36,712.0 | 33,983.0 | 26,172.7 | 27,051.3 | 27,959.4 | 28,898.0 | 29,868.1 |
| Inventories, % | 0.87253 | 1.04 | 2.12 | 2.73 | 2.48 | 1.85 | 1.85 | 1.85 | 1.85 | 1.85 |
| Accounts Payable | 237,729.0 | 206,112.0 | 206,112.0 | 202,665.0 | 226,580.0 | 235,110.2 | 243,002.7 | 251,160.2 | 259,591.4 | 268,305.7 |
| Accounts Payable, % | 19.81 | 16.13 | 15.56 | 15.06 | 16.56 | 16.62 | 16.62 | 16.62 | 16.62 | 16.62 |
| Capital Expenditure | -4,726.0 | -11,700.0 | -9,635.0 | -15,149.0 | -17,770.0 | -12,618.7 | -13,042.3 | -13,480.1 | -13,932.7 | -14,400.4 |
| Capital Expenditure, % | -0.39377 | -0.91551 | -0.72719 | -1.13 | -1.3 | -0.89205 | -0.89205 | -0.89205 | -0.89205 | -0.89205 |
| Tax Rate, % | 41.35 | 41.35 | 41.35 | 41.35 | 41.35 | 41.35 | 41.35 | 41.35 | 41.35 | 41.35 |
| EBITAT | 47,488.1 | 46,503.9 | 12,210.6 | 63,716.3 | 68,651.7 | 51,232.4 | 52,952.2 | 54,729.8 | 56,567.1 | 58,466.0 |
| Depreciation | ||||||||||
| Changes in Account Receivables | ||||||||||
| Changes in Inventories | ||||||||||
| Changes in Accounts Payable | ||||||||||
| Capital Expenditure | ||||||||||
| UFCF | -2,170,266.9 | 625,087.9 | 177,328.6 | 1,848,444.3 | -1,123,583.3 | 1,179,566.7 | 258,842.7 | 267,531.9 | 276,512.7 | 285,795.1 |
| WACC, % | 3.38 | 3.22 | 1.87 | 3.37 | 3.29 | 3.03 | 3.03 | 3.03 | 3.03 | 3.03 |
| PV UFCF | ||||||||||
| SUM PV UFCF | 2,124,985.9 | |||||||||
| Long Term Growth Rate, % | 2.00 | |||||||||
| Free cash flow (T + 1) | 291,511 | |||||||||
| Terminal Value | 28,356,898 | |||||||||
| Present Terminal Value | 24,427,680 | |||||||||
| Enterprise Value | 26,552,666 | |||||||||
| Net Debt | 4,759,666 | |||||||||
| Equity Value | 21,793,000 | |||||||||
| Diluted Shares Outstanding, MM | 491 | |||||||||
| Equity Value Per Share | 44,406.72 |
What You Will Receive
- Authentic Tokyo Century Data: Comprehensive financials – from revenue to EBIT – based on verified and forecasted figures.
- Complete Customization: Modify all essential parameters (highlighted cells) such as WACC, growth rate, and tax percentages.
- Real-Time Valuation Updates: Automatic recalibrations to assess the effects of changes on Tokyo Century's fair value.
- Flexible Excel Template: Designed for easy adjustments, scenario analysis, and in-depth forecasts.
- Efficiency and Precision: Bypass the need to construct models from scratch while ensuring accuracy and adaptability.
Key Features
- 🔍 Real-Life TC Financials: Pre-filled historical and projected data for Tokyo Century Corporation (8439T).
- ✏️ Fully Customizable Inputs: Modify all essential parameters (yellow cells) including WACC, growth %, and tax rates.
- 📊 Professional DCF Valuation: Integrated formulas compute the intrinsic value of Tokyo Century Corporation (8439T) using the Discounted Cash Flow method.
- ⚡ Instant Results: See Tokyo Century Corporation's (8439T) valuation update in real-time as you adjust inputs.
- Scenario Analysis: Explore and compare various financial assumptions and their potential outcomes side-by-side.
How It Works
- Step 1: Download the Excel file.
- Step 2: Examine the pre-filled data for Tokyo Century Corporation (8439T), including both historical and forecasted figures.
- Step 3: Modify key assumptions (highlighted in yellow) according to your analysis.
- Step 4: Observe the automatic recalculations of the intrinsic value for Tokyo Century Corporation (8439T).
- Step 5: Utilize the results to inform your investment choices or reporting activities.
Why Select This Calculator for Tokyo Century Corporation (8439T)?
- Designed for Experts: A sophisticated tool utilized by analysts, CFOs, and consultants.
- Accurate Financials: Tokyo Century’s historical and projected financial data preloaded for precision.
- Scenario Analysis: Effortlessly simulate various forecasts and assumptions.
- Comprehensive Outputs: Instantly calculates intrinsic value, NPV, and critical metrics.
- User-Friendly: Detailed step-by-step instructions walk you through every stage.
Who Can Benefit from This Product?
- Investors: Accurately assess the fair value of Tokyo Century Corporation (8439T) prior to making investment choices.
- CFOs: Utilize a high-caliber DCF model for comprehensive financial reporting and analysis.
- Consultants: Effortlessly customize the template for client valuation reports.
- Entrepreneurs: Acquire valuable insights into financial modeling practices employed by leading corporations.
- Educators: Employ this tool to illustrate various valuation methodologies in the classroom.
What the Template Includes
- Comprehensive DCF Model: Editable template featuring detailed valuation computations.
- Real-World Data: Tokyo Century Corporation’s (8439T) historical and projected financials preloaded for analysis.
- Customizable Parameters: Modify WACC, growth rates, and tax assumptions to explore various scenarios.
- Financial Statements: Complete annual and quarterly breakdowns for enhanced insights.
- Key Ratios: Integrated analysis for profitability, efficiency, and leverage metrics.
- Dashboard with Visual Outputs: Charts and tables providing clear, actionable results.
Disclaimer
All information, articles, and product details provided on this website are for general informational and educational purposes only. We do not claim any ownership over, nor do we intend to infringe upon, any trademarks, copyrights, logos, brand names, or other intellectual property mentioned or depicted on this site. Such intellectual property remains the property of its respective owners, and any references here are made solely for identification or informational purposes, without implying any affiliation, endorsement, or partnership.
We make no representations or warranties, express or implied, regarding the accuracy, completeness, or suitability of any content or products presented. Nothing on this website should be construed as legal, tax, investment, financial, medical, or other professional advice. In addition, no part of this site—including articles or product references—constitutes a solicitation, recommendation, endorsement, advertisement, or offer to buy or sell any securities, franchises, or other financial instruments, particularly in jurisdictions where such activity would be unlawful.
All content is of a general nature and may not address the specific circumstances of any individual or entity. It is not a substitute for professional advice or services. Any actions you take based on the information provided here are strictly at your own risk. You accept full responsibility for any decisions or outcomes arising from your use of this website and agree to release us from any liability in connection with your use of, or reliance upon, the content or products found herein.