
|
East Japan Railway Company (9020.T): BCG Matrix |
Fully Editable: Tailor To Your Needs In Excel Or Sheets
Professional Design: Trusted, Industry-Standard Templates
Investor-Approved Valuation Models
MAC/PC Compatible, Fully Unlocked
No Expertise Is Needed; Easy To Follow
East Japan Railway Company (9020.T) Bundle
The East Japan Railway Company (JR East) presents a compelling case study in the world of transportation, revealing intricate dynamics through the lens of the Boston Consulting Group Matrix. As we delve into its portfolio, we'll uncover how the company balances its high-flying Stars, reliable Cash Cows, struggling Dogs, and intriguing Question Marks. Join us as we explore the strategic positioning of JR East's diverse offerings and what they mean for the future of this pivotal player in the rail industry.
Background of East Japan Railway Company
East Japan Railway Company, commonly known as JR East, was established in 1987 as part of the privatization of the Japanese National Railways. The company is headquartered in Tokyo and operates the majority of the passenger rail services in the Kanto region, including the capital city. With a vast network stretching over 7,000 kilometers, JR East is a key player in the transportation infrastructure of Japan.
As of the fiscal year ended March 2023, JR East reported revenues of approximately 2.4 trillion Japanese yen (around $17 billion USD), showcasing its significance in the rail transport sector. The company’s operations also extend to various businesses, including retail and real estate, which complement its core rail services.
JR East has endeavored to adapt to changing market conditions, particularly through investments in technology and customer service enhancements. The introduction of the Suica smart card system has been a notable success, allowing for seamless travel across multiple modes of transport while also facilitating electronic payments at various outlets.
Despite facing challenges such as the COVID-19 pandemic, which significantly impacted ridership and revenues, JR East remains committed to developing its services. The company has also focused on sustainability, with initiatives aimed at reducing greenhouse gas emissions and promoting energy efficiency in its operations.
In terms of share performance, as of October 2023, JR East's stock is listed on the Tokyo Stock Exchange under the ticker symbol 9020. The company has consistently been viewed as a stable long-term investment, supported by its essential role in Japan's public transportation network and its ongoing strategies for growth and innovation.
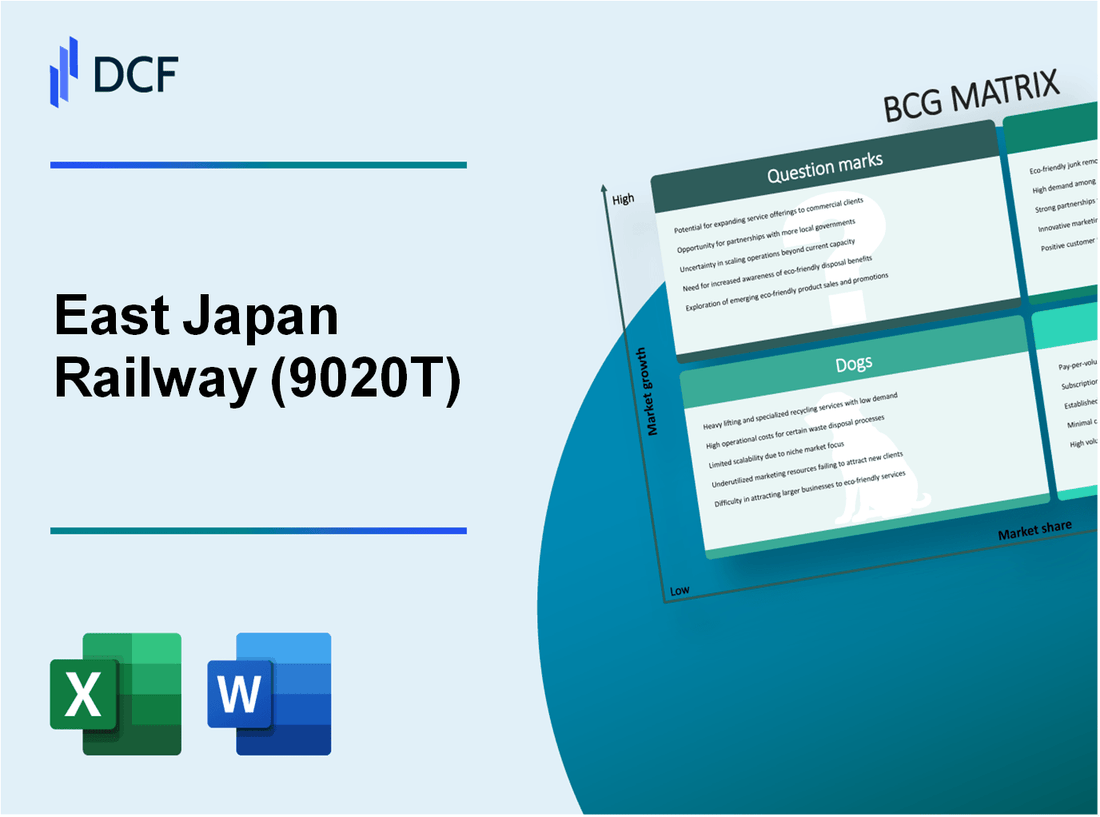
East Japan Railway Company - BCG Matrix: Stars
East Japan Railway Company (JR East) operates several segments that can be categorized as Stars within the BCG Matrix due to their high market share and growth potential. The following segments exemplify this classification:
Shinkansen High-Speed Rail Services
JR East's Shinkansen services are a critical component of its operations, with an extensive network covering over 1,500 kilometers and serving millions of passengers annually. In fiscal year 2022, the Shinkansen achieved a revenue of approximately ¥1 trillion (around $9.1 billion), representing an increase of 12.5% year-over-year as passenger demand rebounded post-pandemic.
Busy Urban Commuter Lines in Tokyo
The Tokyo metropolitan area is one of the world's busiest transit systems, and JR East maintains a dominant position. The company operates several major lines, including the Yamanote Line, which has a daily ridership of approximately 3.6 million passengers. In 2022, the urban transport segment contributed around ¥800 billion (approximately $7.3 billion) to the company's revenue, with growth spurred by the recovery in commuter traffic as work-from-home policies were relaxed.
Real Estate Developments in Prime Locations
JR East has strategically invested in real estate adjacent to its train stations. As of 2023, the company managed around 2.5 million square meters of property, generating annual rental income exceeding ¥120 billion (approximately $1.1 billion). The value of its real estate portfolio is estimated at ¥3 trillion (around $27.3 billion), driven by high demand in urban centers. The company aims to expand this segment further, with plans to develop new properties in prime locations across Tokyo.
Integrated Station Retail Complexes
JR East has also developed integrated retail complexes at major train stations, combining shopping, dining, and entertainment. These complexes generated approximately ¥400 billion (around $3.6 billion) in revenue in 2022, marking an increase of 15% from the previous year. The company's strategy includes enhancing these complexes to provide a seamless customer experience for travelers, thereby boosting foot traffic and sales.
| Segment | Revenue (FY 2022) | Year-Over-Year Growth | Key Statistics |
|---|---|---|---|
| Shinkansen | ¥1 trillion ($9.1 billion) | 12.5% | Network length: 1,500 km |
| Urban Commuter Lines | ¥800 billion ($7.3 billion) | Recovery in passenger traffic | Daily ridership: 3.6 million |
| Real Estate Developments | ¥120 billion ($1.1 billion) | Value: ¥3 trillion ($27.3 billion) | Managed space: 2.5 million sq. meters |
| Integrated Station Retail | ¥400 billion ($3.6 billion) | 15% | Focus on enhancing customer experience |
These segments not only showcase JR East's strong market positioning but also highlight the critical investments and strategies needed to sustain their growth. By focusing on these Stars, JR East aims to maintain and eventually transition them into Cash Cows as market dynamics evolve.
East Japan Railway Company - BCG Matrix: Cash Cows
East Japan Railway Company (JR East) has several cash cows contributing significantly to its cash flow due to their high market share in a mature market. These segments generate substantial revenue while requiring minimal additional investment.
Established Regional Train Services
JR East operates a comprehensive network of regional train services in the Kanto region, which includes Tokyo and its surrounding areas. The company's regional services account for a considerable part of its revenue.
In FY2022, the total revenue for JR East was approximately ¥1.75 trillion, with regional train services contributing around ¥1.2 trillion, indicating a stable cash flow from these mature operations. The average daily ridership for these services is approximately 5 million passengers.
Suica Smart Card System
The Suica card system has become a vital cash cow for JR East, providing a convenient payment method for transportation and retail purchases. As of 2023, the total number of issued Suica cards exceeded 60 million.
In the fiscal year ending March 2022, the Suica system generated revenue of approximately ¥55 billion, primarily from transaction fees. The low operational costs associated with the card system allow JR East to maintain high profit margins in this business segment.
Station Retail and Convenience Stores
JR East's retail operations, including convenience stores and restaurants located in and around train stations, make up another lucrative cash cow. In FY2022, this segment reported revenues of around ¥200 billion, which benefited from the high foot traffic in station areas.
The convenience stores, branded as 'NewDays,' have over 1,000 locations and contribute significantly to the overall cash generation, leveraging the large number of commuters using JR East services every day.
Long-Distance Conventional Rail Services
JR East's long-distance conventional rail services, including the Limited Express trains, serve as another established cash cow. These services have a strong market share and generate consistent revenue streams.
In FY2022, long-distance rail services brought in approximately ¥300 billion. Despite being in a mature market, these services maintain profitability due to the established routes and brand loyalty.
| Segment | Revenue (FY2022) | Market Share | Key Metrics |
|---|---|---|---|
| Established Regional Train Services | ¥1.2 trillion | ~70% | Daily Ridership: 5 million |
| Suica Smart Card System | ¥55 billion | ~60% of cashless transactions in the region | Issued Cards: 60 million |
| Station Retail & Convenience Stores | ¥200 billion | ~80% of station retail market | NewDays Locations: 1,000+ |
| Long-Distance Conventional Rail Services | ¥300 billion | ~65% | Annual Passengers: 30 million |
These cash cows enable JR East to generate significant profits and provide the essential funding for investments in other segments of the business, such as innovations and expansions in areas with higher growth potential.
East Japan Railway Company - BCG Matrix: Dogs
The Dogs category in the BCG Matrix reflects units with low market share in low growth markets. In the context of East Japan Railway Company (JR East), several aspects highlight this trend, particularly in less profitable regions and operations.
Underutilized Regional Lines
JR East operates numerous regional train lines that have seen significant declines in passenger numbers. For instance, the Hokuriku Shinkansen has underperformed compared to its counterparts, achieving only a 57% occupancy rate in recent years. In FY2022, revenue from these lesser-used lines fell by 8.5%, with operating margins shrinking to less than 5%.
Low-Performing Rural Stations
Many rural stations managed by JR East are experiencing diminishing foot traffic. Stations like Oyu Station reported only 40,000 passengers per year, a stark contrast to the 1 million required for sustainable operations. This has resulted in a significant increase in station maintenance costs, which peaked at approximately ¥12 million annually per station, while the average revenue generated was less than ¥3 million.
Outdated Rolling Stock with High Maintenance Costs
JR East's fleet is burdened with older rolling stock, which incurs high maintenance costs. As of FY2023, the cost of maintaining older trains stood at ¥15 billion, while these trains contributed less than ¥5 billion in revenues. The age of the rolling stock has increased operational inefficiencies, leading to additional downtime and repair costs averaging ¥3 million per unit.
Non-Core Subsidiary Businesses
Non-core subsidiaries of JR East have also struggled to generate significant returns. For example, the JR East Retail segment showed a negative growth rate of -4% in FY2022. With total sales reaching only ¥65 billion, the operating loss amounted to ¥3.5 billion. Investment in these subsidiaries has consistently failed to yield positive cash flows, with cash tied up in operations without adequate returns.
| Category | Details | Financial Impact |
|---|---|---|
| Underutilized Regional Lines | Hokuriku Shinkansen | Occupancy Rate: 57% Revenue decline: 8.5% Operating margins: < 5% |
| Low-Performing Rural Stations | Oyu Station | Passenger count: 40,000 Maintenance cost: ¥12 million Annual revenue: < ¥3 million |
| Outdated Rolling Stock | Maintenance costs | Annual cost: ¥15 billion Revenue: < ¥5 billion Average repair costs: ¥3 million per unit |
| Non-Core Subsidiary Businesses | JR East Retail | Negative growth rate: -4% Total sales: ¥65 billion Operating loss: ¥3.5 billion |
East Japan Railway Company - BCG Matrix: Question Marks
East Japan Railway Company (JR East) operates in a competitive and rapidly evolving environment, particularly with respect to its growth initiatives. Within the framework of the BCG Matrix, several segments are categorized as Question Marks, pointing to opportunities that require strategic focus and investment.
International Rail Expansion Projects
As part of its strategic expansion initiatives, JR East aims to extend its operations internationally. For instance, JR East has been involved in projects such as the development of the Shinkansen bullet train technology for use in overseas markets. In 2021, JR East announced a partnership with the Indian government to develop a high-speed rail project, with an estimated investment of approximately ¥1.1 trillion (around $10 billion).
Despite these ambitions, the international segment has yet to generate significant revenue, with overseas sales accounting for only 4.8% of total revenue in the fiscal year 2022.
Technological Innovation in Rail Systems
JR East is keen on advancing its technological capabilities. The company has invested around ¥20 billion (roughly $180 million) in developing autonomous train technology and intelligent transportation systems. However, these innovations currently represent less than 5% of total operational revenue.
While the demand for state-of-the-art rail systems is growing, current market share remains low compared to competitors like Siemens and Alstom, necessitating rapid market penetration strategies to leverage these technologies effectively.
New Mobility Services and Partnerships
In response to the evolving transportation landscape, JR East is expanding into new mobility services. This includes partnerships with ride-sharing services and the launch of its own mobile app, which saw a user base of 1.5 million in the first year. However, this segment has not yet become a significant revenue driver, contributing approximately ¥5 billion ($45 million) to the bottom line in recent fiscal reports.
Digital Transformation Initiatives
JR East is also undergoing a digital transformation, aiming to improve operational efficiency and customer experience. The company has invested around ¥15 billion (about $135 million) in implementing advanced data analytics and AI-driven solutions. Nevertheless, these initiatives currently generate a minimal return, with digital-related revenues representing only 3% of total revenue.
| Initiative | Investment (¥ billion) | Estimated Revenue Contribution (¥ billion) | Market Share (%) | Growth Potential |
|---|---|---|---|---|
| International Rail Expansion | ¥1,100 | ¥20 | 4.8 | High |
| Technological Innovation | ¥20 | 15 | 5 | Moderate |
| Mobility Services | ¥5 | 5 | 1 | High |
| Digital Transformation | ¥15 | 10 | 3 | Moderate |
Understanding these Question Marks is crucial for JR East, as they represent not only the potential for growth but also the risk of becoming Dogs without proper attention and investment.
In the dynamic landscape of East Japan Railway Company's business, the BCG Matrix provides a clear lens through which to evaluate its diverse offerings, highlighting the robust potential of its Stars while strategically managing its Cash Cows, Dogs, and Question Marks to navigate future growth and innovation.
[right_small]Disclaimer
All information, articles, and product details provided on this website are for general informational and educational purposes only. We do not claim any ownership over, nor do we intend to infringe upon, any trademarks, copyrights, logos, brand names, or other intellectual property mentioned or depicted on this site. Such intellectual property remains the property of its respective owners, and any references here are made solely for identification or informational purposes, without implying any affiliation, endorsement, or partnership.
We make no representations or warranties, express or implied, regarding the accuracy, completeness, or suitability of any content or products presented. Nothing on this website should be construed as legal, tax, investment, financial, medical, or other professional advice. In addition, no part of this site—including articles or product references—constitutes a solicitation, recommendation, endorsement, advertisement, or offer to buy or sell any securities, franchises, or other financial instruments, particularly in jurisdictions where such activity would be unlawful.
All content is of a general nature and may not address the specific circumstances of any individual or entity. It is not a substitute for professional advice or services. Any actions you take based on the information provided here are strictly at your own risk. You accept full responsibility for any decisions or outcomes arising from your use of this website and agree to release us from any liability in connection with your use of, or reliance upon, the content or products found herein.