
|
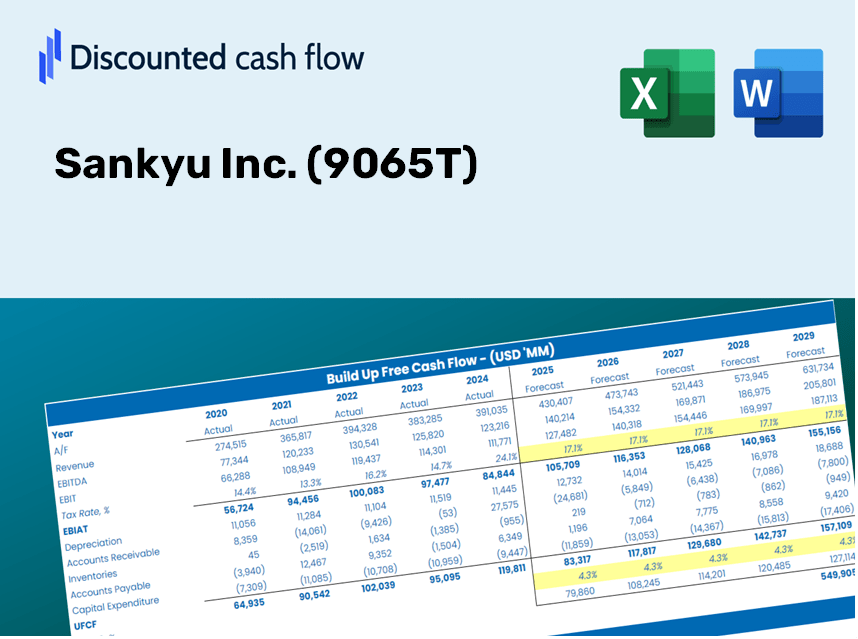
Sankyu Inc. (9065.T) DCF Valuation |
Fully Editable: Tailor To Your Needs In Excel Or Sheets
Professional Design: Trusted, Industry-Standard Templates
Investor-Approved Valuation Models
MAC/PC Compatible, Fully Unlocked
No Expertise Is Needed; Easy To Follow
Sankyu Inc. (9065.T) Bundle
Gain insights into your Sankyu Inc. (9065T) valuation analysis with our state-of-the-art DCF Calculator! Equipped with real (9065T) data, this Excel template enables you to adjust forecasts and assumptions to determine Sankyu Inc.'s intrinsic value with accuracy.
Discounted Cash Flow (DCF) - (USD MM)
| Year | AY1 2020 |
AY2 2021 |
AY3 2022 |
AY4 2023 |
AY5 2024 |
FY1 2025 |
FY2 2026 |
FY3 2027 |
FY4 2028 |
FY5 2029 |
|---|---|---|---|---|---|---|---|---|---|---|
| Revenue | 533,870.0 | 553,831.0 | 579,226.0 | 563,547.0 | 606,791.0 | 626,953.0 | 647,785.0 | 669,309.1 | 691,548.4 | 714,526.7 |
| Revenue Growth, % | 0 | 3.74 | 4.59 | -2.71 | 7.67 | 3.32 | 3.32 | 3.32 | 3.32 | 3.32 |
| EBITDA | 51,146.0 | 53,491.0 | 58,545.0 | 56,832.0 | 65,938.0 | 63,068.2 | 65,163.8 | 67,329.0 | 69,566.2 | 71,877.7 |
| EBITDA, % | 9.58 | 9.66 | 10.11 | 10.08 | 10.87 | 10.06 | 10.06 | 10.06 | 10.06 | 10.06 |
| Depreciation | 17,216.0 | 18,724.0 | 19,508.0 | 19,729.0 | 19,676.0 | 20,961.6 | 21,658.1 | 22,377.7 | 23,121.2 | 23,889.5 |
| Depreciation, % | 3.22 | 3.38 | 3.37 | 3.5 | 3.24 | 3.34 | 3.34 | 3.34 | 3.34 | 3.34 |
| EBIT | 33,930.0 | 34,767.0 | 39,037.0 | 37,103.0 | 46,262.0 | 42,106.7 | 43,505.8 | 44,951.4 | 46,445.0 | 47,988.2 |
| EBIT, % | 6.36 | 6.28 | 6.74 | 6.58 | 7.62 | 6.72 | 6.72 | 6.72 | 6.72 | 6.72 |
| Total Cash | 37,684.0 | 43,619.0 | 52,666.0 | 52,131.0 | 48,599.0 | 51,769.6 | 53,489.8 | 55,267.1 | 57,103.5 | 59,000.9 |
| Total Cash, percent | .0 | .0 | .0 | .0 | .0 | .0 | .0 | .0 | .0 | .0 |
| Account Receivables | 187,678.0 | 181,851.0 | 185,202.0 | 197,696.0 | 218,297.0 | 214,442.6 | 221,568.0 | 228,930.1 | 236,536.8 | 244,396.3 |
| Account Receivables, % | 35.15 | 32.84 | 31.97 | 35.08 | 35.98 | 34.2 | 34.2 | 34.2 | 34.2 | 34.2 |
| Inventories | 2,008.0 | 2,252.0 | 2,220.0 | 3,637.0 | 4,441.0 | 3,189.0 | 3,295.0 | 3,404.5 | 3,517.6 | 3,634.5 |
| Inventories, % | 0.37612 | 0.40662 | 0.38327 | 0.64538 | 0.73188 | 0.50865 | 0.50865 | 0.50865 | 0.50865 | 0.50865 |
| Accounts Payable | 72,385.0 | 74,558.0 | 48,864.0 | 46,498.0 | 52,105.0 | 65,572.8 | 67,751.6 | 70,002.8 | 72,328.8 | 74,732.0 |
| Accounts Payable, % | 13.56 | 13.46 | 8.44 | 8.25 | 8.59 | 10.46 | 10.46 | 10.46 | 10.46 | 10.46 |
| Capital Expenditure | -18,822.0 | -15,438.0 | -16,078.0 | -14,818.0 | -21,463.0 | -19,128.8 | -19,764.4 | -20,421.1 | -21,099.7 | -21,800.8 |
| Capital Expenditure, % | -3.53 | -2.79 | -2.78 | -2.63 | -3.54 | -3.05 | -3.05 | -3.05 | -3.05 | -3.05 |
| Tax Rate, % | 31.67 | 31.67 | 31.67 | 31.67 | 31.67 | 31.67 | 31.67 | 31.67 | 31.67 | 31.67 |
| EBITAT | 22,052.3 | 22,954.9 | 25,334.8 | 24,968.5 | 31,611.0 | 27,920.4 | 28,848.1 | 29,806.6 | 30,797.0 | 31,820.3 |
| Depreciation | ||||||||||
| Changes in Account Receivables | ||||||||||
| Changes in Inventories | ||||||||||
| Changes in Accounts Payable | ||||||||||
| Capital Expenditure | ||||||||||
| UFCF | -96,854.7 | 33,996.9 | -248.2 | 13,602.5 | 14,026.0 | 48,327.2 | 25,689.2 | 26,542.8 | 27,424.7 | 28,336.0 |
| WACC, % | 7.15 | 7.16 | 7.15 | 7.16 | 7.17 | 7.16 | 7.16 | 7.16 | 7.16 | 7.16 |
| PV UFCF | ||||||||||
| SUM PV UFCF | 129,895.5 | |||||||||
| Long Term Growth Rate, % | 2.00 | |||||||||
| Free cash flow (T + 1) | 28,903 | |||||||||
| Terminal Value | 560,340 | |||||||||
| Present Terminal Value | 396,577 | |||||||||
| Enterprise Value | 526,473 | |||||||||
| Net Debt | 41,953 | |||||||||
| Equity Value | 484,520 | |||||||||
| Diluted Shares Outstanding, MM | 54 | |||||||||
| Equity Value Per Share | 8,997.58 |
What You Will Receive
- Authentic Sankyu Inc. (9065T) Financial Data: Pre-loaded with historical and projected figures for accurate analysis.
- Completely Customizable Template: Easily adjust key metrics such as revenue growth, WACC, and EBITDA %.
- Instant Calculations: Watch Sankyu Inc.'s (9065T) intrinsic value update in real-time as you make adjustments.
- Expert Valuation Tool: Tailored for investors, analysts, and consultants aiming for reliable DCF outcomes.
- User-Friendly Interface: Intuitive layout and straightforward instructions suitable for users of all skill levels.
Key Features
- Customizable Forecast Inputs: Adjust essential parameters such as revenue growth, EBITDA %, and capital expenditures.
- Instant DCF Valuation: Quickly computes intrinsic value, NPV, and other financial metrics.
- High-Precision Accuracy: Leverages Sankyu Inc.'s (9065T) actual financial data for reliable valuation results.
- Effortless Scenario Analysis: Easily explore various assumptions and evaluate their impacts side by side.
- Efficiency Booster: Removes the necessity to create intricate valuation models from the ground up.
How It Works
- Step 1: Download the Excel file.
- Step 2: Examine Sankyu Inc.'s pre-filled financial data and projections.
- Step 3: Adjust key inputs such as revenue growth, WACC, and tax rates (highlighted cells).
- Step 4: Observe the DCF model refresh in real-time as you modify your assumptions.
- Step 5: Evaluate the outputs and leverage the results for your investment strategies.
Why Opt for Sankyu Inc. (9065T) Calculator?
- Time-Saving: Skip the hassle of building a DCF model from scratch – it's ready for immediate use.
- Enhanced Accuracy: Dependable financial data and formulas minimize valuation errors.
- Fully Adaptable: Customize the model to suit your assumptions and forecasts.
- User-Friendly: Intuitive charts and outputs facilitate easy analysis of the results.
- Expert Endorsed: Crafted for professionals who prioritize exactness and functionality.
Who Can Benefit from This Product?
- Investors: Evaluate Sankyu Inc.’s (9065T) intrinsic value to inform your investment strategies.
- CFOs: Utilize a robust DCF model for precise financial reporting and analysis for Sankyu Inc. (9065T).
- Consultants: Seamlessly customize the template to create valuation reports tailored for your clients involving Sankyu Inc. (9065T).
- Entrepreneurs: Discover financial modeling techniques employed by leading firms, including Sankyu Inc. (9065T).
- Educators: Implement it as an educational resource to illustrate key valuation methods related to Sankyu Inc. (9065T).
Contents of the Template
- Pre-Filled Data: Features Sankyu Inc.'s historical financial performance and projections.
- Discounted Cash Flow Model: An editable DCF valuation model with automatic calculations for ease of use.
- Weighted Average Cost of Capital (WACC): A dedicated sheet for computing WACC based on customized inputs.
- Key Financial Ratios: Evaluate Sankyu Inc.'s profitability, efficiency, and financial leverage.
- Customizable Inputs: Easily modify revenue growth, profit margins, and tax rates.
- Clear Dashboard: Visual representations including charts and tables summarizing essential valuation results.
Disclaimer
All information, articles, and product details provided on this website are for general informational and educational purposes only. We do not claim any ownership over, nor do we intend to infringe upon, any trademarks, copyrights, logos, brand names, or other intellectual property mentioned or depicted on this site. Such intellectual property remains the property of its respective owners, and any references here are made solely for identification or informational purposes, without implying any affiliation, endorsement, or partnership.
We make no representations or warranties, express or implied, regarding the accuracy, completeness, or suitability of any content or products presented. Nothing on this website should be construed as legal, tax, investment, financial, medical, or other professional advice. In addition, no part of this site—including articles or product references—constitutes a solicitation, recommendation, endorsement, advertisement, or offer to buy or sell any securities, franchises, or other financial instruments, particularly in jurisdictions where such activity would be unlawful.
All content is of a general nature and may not address the specific circumstances of any individual or entity. It is not a substitute for professional advice or services. Any actions you take based on the information provided here are strictly at your own risk. You accept full responsibility for any decisions or outcomes arising from your use of this website and agree to release us from any liability in connection with your use of, or reliance upon, the content or products found herein.