
|
Nippon Yusen Kabushiki Kaisha (9101.T) DCF Valuation |
Fully Editable: Tailor To Your Needs In Excel Or Sheets
Professional Design: Trusted, Industry-Standard Templates
Investor-Approved Valuation Models
MAC/PC Compatible, Fully Unlocked
No Expertise Is Needed; Easy To Follow
Nippon Yusen Kabushiki Kaisha (9101.T) Bundle
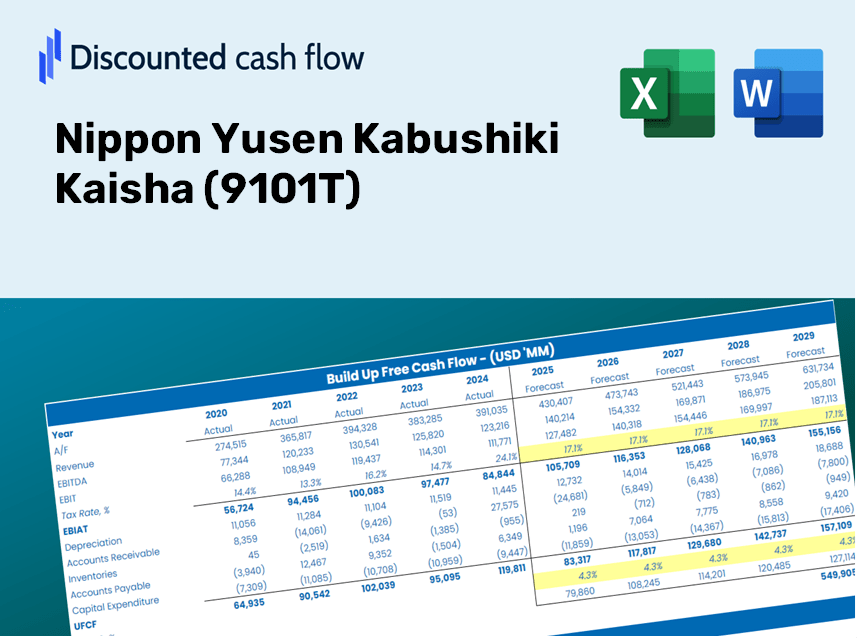
Simplify Nippon Yusen Kabushiki Kaisha (9101T) valuation with this customizable DCF Calculator! Featuring real Nippon Yusen Kabushiki Kaisha (9101T) financials and adjustable forecast inputs, you can test scenarios and uncover Nippon Yusen Kabushiki Kaisha (9101T) fair value in minutes.
Discounted Cash Flow (DCF) - (USD MM)
| Year | AY1 2021 |
AY2 2022 |
AY3 2023 |
AY4 2024 |
AY5 2025 |
FY1 2026 |
FY2 2027 |
FY3 2028 |
FY4 2029 |
FY5 2030 |
|---|---|---|---|---|---|---|---|---|---|---|
| Revenue | 1,608,414.0 | 2,280,775.0 | 2,616,066.0 | 2,387,240.0 | 2,588,700.0 | 2,952,383.6 | 3,367,160.8 | 3,840,209.6 | 4,379,716.4 | 4,995,018.0 |
| Revenue Growth, % | 0 | 41.8 | 14.7 | -8.75 | 8.44 | 14.05 | 14.05 | 14.05 | 14.05 | 14.05 |
| EBITDA | 286,984.0 | 1,152,115.0 | 1,222,243.0 | 477,095.0 | 690,208.0 | 954,948.8 | 1,089,108.6 | 1,242,116.3 | 1,416,619.8 | 1,615,639.2 |
| EBITDA, % | 17.84 | 50.51 | 46.72 | 19.99 | 26.66 | 32.35 | 32.35 | 32.35 | 32.35 | 32.35 |
| Depreciation | 100,585.0 | 102,520.0 | 123,413.0 | 144,426.0 | 154,632.0 | 162,318.5 | 185,122.5 | 211,130.1 | 240,791.6 | 274,620.1 |
| Depreciation, % | 6.25 | 4.49 | 4.72 | 6.05 | 5.97 | 5.5 | 5.5 | 5.5 | 5.5 | 5.5 |
| EBIT | 186,399.0 | 1,049,595.0 | 1,098,830.0 | 332,669.0 | 535,576.0 | 792,630.3 | 903,986.1 | 1,030,986.1 | 1,175,828.2 | 1,341,019.1 |
| EBIT, % | 11.59 | 46.02 | 42 | 13.94 | 20.69 | 26.85 | 26.85 | 26.85 | 26.85 | 26.85 |
| Total Cash | 107,513.0 | 233,019.0 | 204,817.0 | 156,163.0 | 156,012.0 | 220,238.9 | 251,180.1 | 286,468.1 | 326,713.6 | 372,613.3 |
| Total Cash, percent | .0 | .0 | .0 | .0 | .0 | .0 | .0 | .0 | .0 | .0 |
| Account Receivables | 232,808.0 | 355,725.0 | 335,140.0 | 350,747.0 | 347,125.0 | 419,142.3 | 478,027.1 | 545,184.6 | 621,777.0 | 709,129.8 |
| Account Receivables, % | 14.47 | 15.6 | 12.81 | 14.69 | 13.41 | 14.2 | 14.2 | 14.2 | 14.2 | 14.2 |
| Inventories | 37,619.0 | 57,029.0 | 57,593.0 | 69,886.0 | 64,641.0 | 73,605.0 | 83,945.7 | 95,739.1 | 109,189.4 | 124,529.3 |
| Inventories, % | 2.34 | 2.5 | 2.2 | 2.93 | 2.5 | 2.49 | 2.49 | 2.49 | 2.49 | 2.49 |
| Accounts Payable | 168,690.0 | 218,650.0 | 206,153.0 | 228,287.0 | 231,949.0 | 274,440.3 | 312,996.1 | 356,968.6 | 407,118.7 | 464,314.4 |
| Accounts Payable, % | 10.49 | 9.59 | 7.88 | 9.56 | 8.96 | 9.3 | 9.3 | 9.3 | 9.3 | 9.3 |
| Capital Expenditure | -102,087.0 | -192,726.0 | -198,360.0 | -336,281.0 | -206,506.0 | -262,427.2 | -299,295.3 | -341,342.9 | -389,297.8 | -443,989.9 |
| Capital Expenditure, % | -6.35 | -8.45 | -7.58 | -14.09 | -7.98 | -8.89 | -8.89 | -8.89 | -8.89 | -8.89 |
| Tax Rate, % | 7.32 | 7.32 | 7.32 | 7.32 | 7.32 | 7.32 | 7.32 | 7.32 | 7.32 | 7.32 |
| EBITAT | 152,284.1 | 1,021,051.0 | 1,026,904.7 | 238,516.7 | 496,387.3 | 692,463.4 | 789,746.8 | 900,697.5 | 1,027,235.5 | 1,171,550.7 |
| Depreciation | ||||||||||
| Changes in Account Receivables | ||||||||||
| Changes in Inventories | ||||||||||
| Changes in Accounts Payable | ||||||||||
| Capital Expenditure | ||||||||||
| UFCF | 49,045.1 | 838,478.0 | 959,481.7 | 40,895.7 | 457,042.3 | 553,864.8 | 644,904.3 | 735,506.2 | 838,836.7 | 956,683.9 |
| WACC, % | 7.04 | 7.17 | 7.14 | 6.95 | 7.13 | 7.09 | 7.09 | 7.09 | 7.09 | 7.09 |
| PV UFCF | ||||||||||
| SUM PV UFCF | 2,995,751.0 | |||||||||
| Long Term Growth Rate, % | 2.00 | |||||||||
| Free cash flow (T + 1) | 975,818 | |||||||||
| Terminal Value | 19,184,204 | |||||||||
| Present Terminal Value | 13,622,875 | |||||||||
| Enterprise Value | 16,618,626 | |||||||||
| Net Debt | 582,449 | |||||||||
| Equity Value | 16,036,177 | |||||||||
| Diluted Shares Outstanding, MM | 446 | |||||||||
| Equity Value Per Share | 35,929.61 |
What You Will Receive
- Authentic NYK Financials: Access historical and projected data for precise valuation.
- Customizable Inputs: Adjust WACC, tax rates, revenue growth, and capital expenditures to fit your analysis.
- Dynamic Calculations: Intrinsic value and NPV calculations update automatically.
- Scenario Testing: Evaluate various scenarios to assess the future performance of Nippon Yusen Kabushiki Kaisha (9101T).
- User-Friendly Design: Designed for industry professionals while remaining accessible to newcomers.
Key Features
- 🔍 Real-Life NYK Financials: Pre-filled historical and projected data for Nippon Yusen Kabushiki Kaisha (9101T).
- ✏️ Fully Customizable Inputs: Adjust all critical parameters (yellow cells) such as WACC, growth %, and tax rates.
- 📊 Professional DCF Valuation: Integrated formulas compute Nippon Yusen's intrinsic value using the Discounted Cash Flow method.
- ⚡ Instant Results: View Nippon Yusen's valuation immediately after modifications.
- Scenario Analysis: Evaluate and compare different financial assumptions side-by-side.
How It Functions
- Download: Get the pre-prepared Excel file featuring Nippon Yusen Kabushiki Kaisha's (9101T) financial data.
- Customize: Modify forecasts such as revenue increase, EBITDA %, and WACC according to your requirements.
- Automatic Updates: The intrinsic value and NPV calculations refresh in real-time.
- Scenario Testing: Develop various projections and instantly compare the results.
- Strategic Decision-Making: Leverage the valuation insights to shape your investment strategy.
Why Choose This Calculator for Nippon Yusen Kabushiki Kaisha (9101T)?
- Reliable Data: Access authentic financials from Nippon Yusen Kabushiki Kaisha (9101T) for trustworthy valuation outcomes.
- Customizable Features: Tailor essential inputs such as growth rates, WACC, and tax rates to align with your financial forecasts.
- Efficiency Boost: Built-in calculations streamline your process, saving you time and effort.
- Professional-Quality Tool: Crafted specifically for investors, analysts, and consultants in the shipping industry.
- Easy to Use: User-friendly design and clear, step-by-step guidance make it accessible for everyone.
Who Can Benefit from This Product?
- Individual Investors: Make informed choices regarding the purchase or sale of Nippon Yusen Kabushiki Kaisha (9101T) stock.
- Financial Analysts: Enhance valuation methodologies with pre-built financial models specific to Nippon Yusen Kabushiki Kaisha (9101T).
- Consultants: Provide accurate and timely valuation insights for clients utilizing Nippon Yusen Kabushiki Kaisha (9101T) data.
- Business Owners: Gain an understanding of how major corporations like Nippon Yusen Kabushiki Kaisha (9101T) are valued to inform your strategic decisions.
- Finance Students: Explore valuation practices with real-world examples related to Nippon Yusen Kabushiki Kaisha (9101T).
Contents of the Template
- Operating and Balance Sheet Data: Pre-filled historical data and forecasts for Nippon Yusen Kabushiki Kaisha (9101T), including metrics such as revenue, EBITDA, EBIT, and capital expenditures.
- WACC Calculation: A specifically designed sheet for the Weighted Average Cost of Capital (WACC), featuring key parameters such as Beta, risk-free rate, and share price.
- DCF Valuation (Unlevered and Levered): Customizable Discounted Cash Flow models that illustrate intrinsic value with comprehensive calculations.
- Financial Statements: Pre-loaded annual and quarterly financial statements to enhance analysis capabilities.
- Key Ratios: A collection of profitability, leverage, and efficiency ratios pertinent to Nippon Yusen Kabushiki Kaisha (9101T).
- Dashboard and Charts: Visual representations of valuation outputs and assumptions for simplified analysis of results.
Disclaimer
All information, articles, and product details provided on this website are for general informational and educational purposes only. We do not claim any ownership over, nor do we intend to infringe upon, any trademarks, copyrights, logos, brand names, or other intellectual property mentioned or depicted on this site. Such intellectual property remains the property of its respective owners, and any references here are made solely for identification or informational purposes, without implying any affiliation, endorsement, or partnership.
We make no representations or warranties, express or implied, regarding the accuracy, completeness, or suitability of any content or products presented. Nothing on this website should be construed as legal, tax, investment, financial, medical, or other professional advice. In addition, no part of this site—including articles or product references—constitutes a solicitation, recommendation, endorsement, advertisement, or offer to buy or sell any securities, franchises, or other financial instruments, particularly in jurisdictions where such activity would be unlawful.
All content is of a general nature and may not address the specific circumstances of any individual or entity. It is not a substitute for professional advice or services. Any actions you take based on the information provided here are strictly at your own risk. You accept full responsibility for any decisions or outcomes arising from your use of this website and agree to release us from any liability in connection with your use of, or reliance upon, the content or products found herein.