
|
SKY Perfect JSAT Holdings Inc. (9412.T) DCF Valuation |
Fully Editable: Tailor To Your Needs In Excel Or Sheets
Professional Design: Trusted, Industry-Standard Templates
Investor-Approved Valuation Models
MAC/PC Compatible, Fully Unlocked
No Expertise Is Needed; Easy To Follow
SKY Perfect JSAT Holdings Inc. (9412.T) Bundle
Reveal the true value of SKY Perfect JSAT Holdings Inc. (9412T) with our professional-grade DCF Calculator! Adjust key assumptions, explore various scenarios, and examine how changes affect the valuation of SKY Perfect JSAT Holdings Inc. (9412T) – all within a single Excel template.
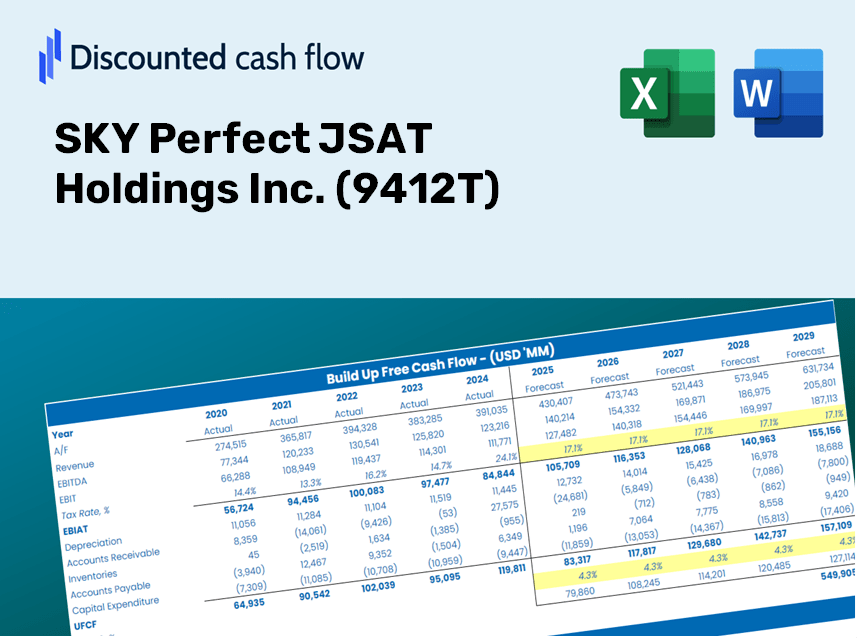
Discounted Cash Flow (DCF) - (USD MM)
| Year | AY1 2020 |
AY2 2021 |
AY3 2022 |
AY4 2023 |
AY5 2024 |
FY1 2025 |
FY2 2026 |
FY3 2027 |
FY4 2028 |
FY5 2029 |
|---|---|---|---|---|---|---|---|---|---|---|
| Revenue | 139,572.0 | 119,632.0 | 121,139.0 | 121,872.0 | 123,721.0 | 120,348.2 | 117,067.3 | 113,875.9 | 110,771.5 | 107,751.7 |
| Revenue Growth, % | 0 | -14.29 | 1.26 | 0.60509 | 1.52 | -2.73 | -2.73 | -2.73 | -2.73 | -2.73 |
| EBITDA | 45,357.0 | 44,374.0 | 45,851.0 | 48,387.0 | 47,757.0 | 44,707.6 | 43,488.8 | 42,303.3 | 41,150.0 | 40,028.2 |
| EBITDA, % | 32.5 | 37.09 | 37.85 | 39.7 | 38.6 | 37.15 | 37.15 | 37.15 | 37.15 | 37.15 |
| Depreciation | 24,201.0 | 23,038.0 | 21,232.0 | 20,231.0 | 18,283.0 | 20,579.9 | 20,018.9 | 19,473.1 | 18,942.3 | 18,425.9 |
| Depreciation, % | 17.34 | 19.26 | 17.53 | 16.6 | 14.78 | 17.1 | 17.1 | 17.1 | 17.1 | 17.1 |
| EBIT | 21,156.0 | 21,336.0 | 24,619.0 | 28,156.0 | 29,474.0 | 24,127.7 | 23,470.0 | 22,830.1 | 22,207.7 | 21,602.3 |
| EBIT, % | 15.16 | 17.83 | 20.32 | 23.1 | 23.82 | 20.05 | 20.05 | 20.05 | 20.05 | 20.05 |
| Total Cash | 73,193.0 | 85,914.0 | 107,908.0 | 114,321.0 | 114,515.0 | 96,205.7 | 93,583.0 | 91,031.8 | 88,550.1 | 86,136.1 |
| Total Cash, percent | .0 | .0 | .0 | .0 | .0 | .0 | .0 | .0 | .0 | .0 |
| Account Receivables | 116,832.0 | 113,472.0 | 111,955.0 | 104,939.0 | 99,332.0 | 105,273.3 | 102,403.4 | 99,611.8 | 96,896.2 | 94,254.7 |
| Account Receivables, % | 83.71 | 94.85 | 92.42 | 86.11 | 80.29 | 87.47 | 87.47 | 87.47 | 87.47 | 87.47 |
| Inventories | 3,350.0 | 1,380.0 | 1,809.0 | 2,766.0 | 2,987.0 | 2,342.2 | 2,278.4 | 2,216.2 | 2,155.8 | 2,097.1 |
| Inventories, % | 2.4 | 1.15 | 1.49 | 2.27 | 2.41 | 1.95 | 1.95 | 1.95 | 1.95 | 1.95 |
| Accounts Payable | 516.0 | 137.0 | 254.0 | 162.0 | 82.0 | 215.0 | 209.1 | 203.4 | 197.9 | 192.5 |
| Accounts Payable, % | 0.3697 | 0.11452 | 0.20968 | 0.13293 | 0.06627816 | 0.17862 | 0.17862 | 0.17862 | 0.17862 | 0.17862 |
| Capital Expenditure | -12,236.0 | -8,375.0 | -17,415.0 | -15,375.0 | -21,577.0 | -14,489.7 | -14,094.7 | -13,710.5 | -13,336.7 | -12,973.1 |
| Capital Expenditure, % | -8.77 | -7 | -14.38 | -12.62 | -17.44 | -12.04 | -12.04 | -12.04 | -12.04 | -12.04 |
| Tax Rate, % | 31.61 | 31.61 | 31.61 | 31.61 | 31.61 | 31.61 | 31.61 | 31.61 | 31.61 | 31.61 |
| EBITAT | 14,196.6 | 15,341.2 | 16,833.6 | 19,020.5 | 20,157.1 | 16,567.4 | 16,115.7 | 15,676.4 | 15,249.0 | 14,833.3 |
| Depreciation | ||||||||||
| Changes in Account Receivables | ||||||||||
| Changes in Inventories | ||||||||||
| Changes in Accounts Payable | ||||||||||
| Capital Expenditure | ||||||||||
| UFCF | -93,504.4 | 34,955.2 | 21,855.6 | 29,843.5 | 22,169.1 | 17,494.0 | 24,967.8 | 24,287.1 | 23,625.0 | 22,981.0 |
| WACC, % | 4.47 | 4.49 | 4.48 | 4.47 | 4.48 | 4.48 | 4.48 | 4.48 | 4.48 | 4.48 |
| PV UFCF | ||||||||||
| SUM PV UFCF | 99,205.2 | |||||||||
| Long Term Growth Rate, % | 1.00 | |||||||||
| Free cash flow (T + 1) | 23,211 | |||||||||
| Terminal Value | 667,574 | |||||||||
| Present Terminal Value | 536,288 | |||||||||
| Enterprise Value | 635,493 | |||||||||
| Net Debt | -23,403 | |||||||||
| Equity Value | 658,896 | |||||||||
| Diluted Shares Outstanding, MM | 283 | |||||||||
| Equity Value Per Share | 2,325.57 |
What You Will Receive
- Accurate 9412T Financial Data: Comprehensive historical and projected figures for precise valuation.
- Customizable Inputs: Adjust WACC, tax rates, revenue growth, and capital expenditures as needed.
- Automated Calculations: Dynamic computation of intrinsic value and NPV.
- Scenario Analysis: Explore various scenarios to assess SKY Perfect JSAT Holdings Inc.'s future performance.
- User-Friendly Design: Tailored for industry professionals while remaining approachable for newcomers.
Key Features
- Pre-Loaded Data: SKY Perfect JSAT's historical financial statements and pre-filled forecasts.
- Fully Adjustable Inputs: Customize WACC, tax rates, revenue growth, and EBITDA margins.
- Instant Results: View SKY Perfect JSAT’s intrinsic value recalculating in real time.
- Clear Visual Outputs: Dashboard charts showcase valuation results and key metrics.
- Built for Accuracy: A professional tool designed for analysts, investors, and finance specialists.
How It Works
- Step 1: Download the Excel file.
- Step 2: Review SKY Perfect JSAT Holdings Inc.’s pre-filled financial data and forecasts.
- Step 3: Adjust essential inputs such as revenue growth, WACC, and tax rates (highlighted cells).
- Step 4: Observe the DCF model refresh in real-time as you modify your assumptions.
- Step 5: Evaluate the results and utilize the findings for your investment strategies.
Why Choose This Calculator for SKY Perfect JSAT Holdings Inc. (9412T)?
- User-Friendly Interface: Perfectly crafted for both novices and seasoned pros.
- Customizable Inputs: Effortlessly adjust parameters to suit your financial analysis.
- Real-Time Updates: Observe immediate changes in SKY Perfect JSAT's valuation as you modify inputs.
- Preloaded Data: Comes equipped with SKY Perfect JSAT’s actual financial metrics for swift evaluations.
- Relied Upon by Experts: Widely used by investors and analysts for making well-informed decisions.
Who Can Benefit from This Product?
- Institutional Investors: Create comprehensive and trustworthy valuation models for analyzing SKP Perfect JSAT Holdings Inc. (9412T) investments.
- Corporate Finance Departments: Evaluate valuation scenarios to inform strategic direction for the organization.
- Financial Consultants and Advisors: Deliver precise valuation insights to clients regarding SKP Perfect JSAT Holdings Inc. (9412T) stock.
- Academics and Students: Utilize practical data to enhance learning and practice in financial modeling.
- Technology Investors: Gain insights into how telecommunications companies like SKP Perfect JSAT Holdings Inc. (9412T) are valued in the marketplace.
What the Template Includes
- Pre-Filled Data: Contains SKY Perfect JSAT Holdings Inc.'s historical financials and projections.
- Discounted Cash Flow Model: An editable DCF valuation model featuring automatic calculations.
- Weighted Average Cost of Capital (WACC): A dedicated worksheet for calculating WACC based on your custom inputs.
- Key Financial Ratios: Evaluate SKY Perfect JSAT's profitability, efficiency, and leverage.
- Customizable Inputs: Easily modify revenue growth, margins, and tax rates.
- Comprehensive Dashboard: Visual summaries including charts and tables that highlight key valuation results.
Disclaimer
All information, articles, and product details provided on this website are for general informational and educational purposes only. We do not claim any ownership over, nor do we intend to infringe upon, any trademarks, copyrights, logos, brand names, or other intellectual property mentioned or depicted on this site. Such intellectual property remains the property of its respective owners, and any references here are made solely for identification or informational purposes, without implying any affiliation, endorsement, or partnership.
We make no representations or warranties, express or implied, regarding the accuracy, completeness, or suitability of any content or products presented. Nothing on this website should be construed as legal, tax, investment, financial, medical, or other professional advice. In addition, no part of this site—including articles or product references—constitutes a solicitation, recommendation, endorsement, advertisement, or offer to buy or sell any securities, franchises, or other financial instruments, particularly in jurisdictions where such activity would be unlawful.
All content is of a general nature and may not address the specific circumstances of any individual or entity. It is not a substitute for professional advice or services. Any actions you take based on the information provided here are strictly at your own risk. You accept full responsibility for any decisions or outcomes arising from your use of this website and agree to release us from any liability in connection with your use of, or reliance upon, the content or products found herein.