
|
Tohoku Electric Power Company, Incorporated (9506.T) DCF Valuation |
Fully Editable: Tailor To Your Needs In Excel Or Sheets
Professional Design: Trusted, Industry-Standard Templates
Investor-Approved Valuation Models
MAC/PC Compatible, Fully Unlocked
No Expertise Is Needed; Easy To Follow
Tohoku Electric Power Company, Incorporated (9506.T) Bundle
Explore the financial prospects of Tohoku Electric Power Company, Incorporated (9506T) with our user-friendly DCF Calculator! Simply enter your assumptions regarding growth, margins, and costs to calculate the intrinsic value of Tohoku Electric Power Company, Incorporated (9506T) and enhance your investment decisions.
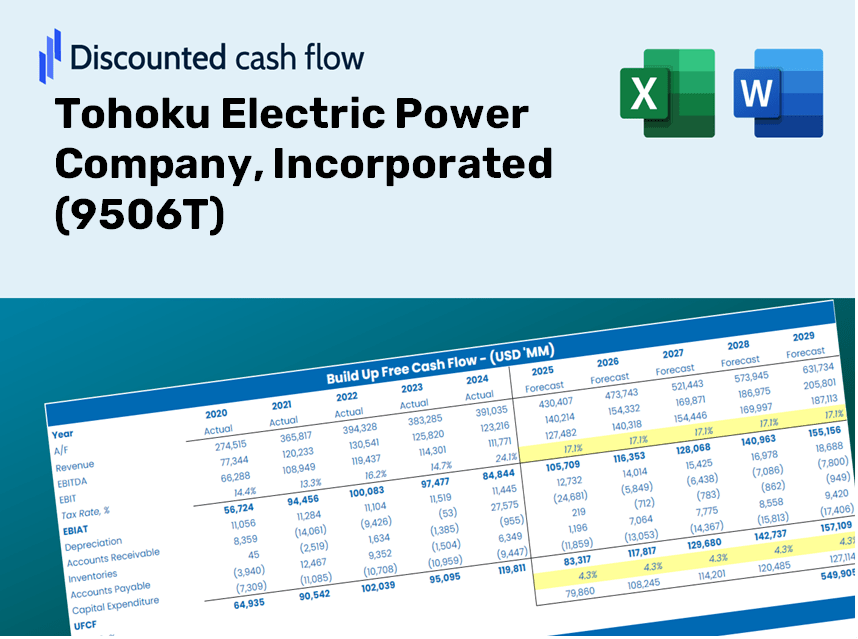
Discounted Cash Flow (DCF) - (USD MM)
| Year | AY1 2021 |
AY2 2022 |
AY3 2023 |
AY4 2024 |
AY5 2025 |
FY1 2026 |
FY2 2027 |
FY3 2028 |
FY4 2029 |
FY5 2030 |
|---|---|---|---|---|---|---|---|---|---|---|
| Revenue | 2,286,803.0 | 2,104,448.0 | 3,007,204.0 | 2,817,813.0 | 2,644,911.0 | 2,793,616.8 | 2,950,683.3 | 3,116,580.6 | 3,291,805.2 | 3,476,881.5 |
| Revenue Growth, % | 0 | -7.97 | 42.9 | -6.3 | -6.14 | 5.62 | 5.62 | 5.62 | 5.62 | 5.62 |
| EBITDA | 298,732.0 | 128,725.0 | 13,078.0 | 516,258.0 | 489,841.0 | 315,434.9 | 333,169.7 | 351,901.6 | 371,686.7 | 392,584.1 |
| EBITDA, % | 13.06 | 6.12 | 0.43489 | 18.32 | 18.52 | 11.29 | 11.29 | 11.29 | 11.29 | 11.29 |
| Depreciation | 228,784.0 | 182,445.0 | 193,452.0 | 193,995.0 | 207,188.0 | 222,511.8 | 235,022.1 | 248,235.9 | 262,192.5 | 276,933.9 |
| Depreciation, % | 10 | 8.67 | 6.43 | 6.88 | 7.83 | 7.97 | 7.97 | 7.97 | 7.97 | 7.97 |
| EBIT | 69,948.0 | -53,720.0 | -180,374.0 | 322,263.0 | 282,653.0 | 92,923.1 | 98,147.5 | 103,665.7 | 109,494.2 | 115,650.3 |
| EBIT, % | 3.06 | -2.55 | -6 | 11.44 | 10.69 | 3.33 | 3.33 | 3.33 | 3.33 | 3.33 |
| Total Cash | 205,290.0 | 274,771.0 | 506,752.0 | 483,709.0 | 551,490.0 | 429,670.6 | 453,828.1 | 479,343.8 | 506,294.2 | 534,759.7 |
| Total Cash, percent | .0 | .0 | .0 | .0 | .0 | .0 | .0 | .0 | .0 | .0 |
| Account Receivables | 269,489.0 | 231,049.0 | 262,633.0 | 261,550.0 | 221,095.0 | 274,547.4 | 289,983.4 | 306,287.3 | 323,507.8 | 341,696.5 |
| Account Receivables, % | 11.78 | 10.98 | 8.73 | 9.28 | 8.36 | 9.83 | 9.83 | 9.83 | 9.83 | 9.83 |
| Inventories | 65,255.0 | 91,520.0 | 136,823.0 | 92,806.0 | 78,861.0 | 100,723.5 | 106,386.5 | 112,367.9 | 118,685.6 | 125,358.5 |
| Inventories, % | 2.85 | 4.35 | 4.55 | 3.29 | 2.98 | 3.61 | 3.61 | 3.61 | 3.61 | 3.61 |
| Accounts Payable | 142,186.0 | 222,513.0 | 254,947.0 | 231,281.0 | 202,718.0 | 229,866.0 | 242,789.8 | 256,440.3 | 270,858.2 | 286,086.8 |
| Accounts Payable, % | 6.22 | 10.57 | 8.48 | 8.21 | 7.66 | 8.23 | 8.23 | 8.23 | 8.23 | 8.23 |
| Capital Expenditure | -296,701.0 | -276,127.0 | -308,188.0 | -357,236.0 | -394,076.0 | -357,142.1 | -377,221.9 | -398,430.6 | -420,831.7 | -444,492.2 |
| Capital Expenditure, % | -12.97 | -13.12 | -10.25 | -12.68 | -14.9 | -12.78 | -12.78 | -12.78 | -12.78 | -12.78 |
| Tax Rate, % | 28.79 | 28.79 | 28.79 | 28.79 | 28.79 | 28.79 | 28.79 | 28.79 | 28.79 | 28.79 |
| EBITAT | 37,711.2 | -85,294.1 | -115,506.6 | 249,586.6 | 201,269.6 | 68,132.3 | 71,962.9 | 76,008.9 | 80,282.4 | 84,796.2 |
| Depreciation | ||||||||||
| Changes in Account Receivables | ||||||||||
| Changes in Inventories | ||||||||||
| Changes in Accounts Payable | ||||||||||
| Capital Expenditure | ||||||||||
| UFCF | -222,763.8 | -86,474.1 | -274,695.6 | 107,779.6 | 40,218.6 | -114,665.0 | -78,412.0 | -82,820.5 | -87,477.0 | -92,395.2 |
| WACC, % | 2.33 | 3.73 | 2.64 | 3.05 | 2.86 | 2.92 | 2.92 | 2.92 | 2.92 | 2.92 |
| PV UFCF | ||||||||||
| SUM PV UFCF | -419,362.5 | |||||||||
| Long Term Growth Rate, % | 2.00 | |||||||||
| Free cash flow (T + 1) | -94,243 | |||||||||
| Terminal Value | -10,224,954 | |||||||||
| Present Terminal Value | -8,853,737 | |||||||||
| Enterprise Value | -9,273,100 | |||||||||
| Net Debt | 2,457,519 | |||||||||
| Equity Value | -11,730,619 | |||||||||
| Diluted Shares Outstanding, MM | 500 | |||||||||
| Equity Value Per Share | -23,454.20 |
Your Benefits
- Customizable Excel Template: A tailor-made Excel-based DCF Calculator featuring pre-loaded financial data for Tohoku Electric Power Company (9506T).
- Accurate Data: Comprehensive historical data and projections (highlighted in the yellow cells).
- Adaptable Forecasts: Modify key assumptions such as revenue growth, EBITDA margin, and WACC at your convenience.
- Instant Calculations: Quickly observe how your inputs affect the valuation of Tohoku Electric Power Company (9506T).
- Professional Resource: Designed for investors, CFOs, consultants, and financial analysts.
- Intuitive Layout: Organized for simplicity and ease of navigation, complete with step-by-step guidance.
Key Features
- Comprehensive DCF Calculator: Features thorough unlevered and levered DCF valuation models tailored for Tohoku Electric Power Company (9506T).
- WACC Calculator: Comes with a pre-designed Weighted Average Cost of Capital sheet that allows for customized inputs.
- Adjustable Forecast Assumptions: Easily change growth rates, capital expenditures, and discount rates according to your analysis needs.
- Integrated Financial Ratios: Evaluate profitability, leverage, and efficiency ratios specifically for Tohoku Electric Power Company (9506T).
- Visual Dashboard and Charts: Provides graphical representations that encapsulate key valuation metrics for streamlined analysis.
How It Functions
- Obtain the Template: Gain immediate access to the Excel-based Tohoku Electric DCF Calculator.
- Enter Your Assumptions: Modify the yellow-highlighted cells for growth projections, WACC, margins, and additional metrics.
- Real-Time Calculations: The model automatically recalculates Tohoku Electric's intrinsic value.
- Evaluate Scenarios: Test various assumptions to assess the impact on potential valuations.
- Examine and Decide: Leverage the findings to inform your investment or financial decisions.
Why Opt for This Calculator?
- Precise Metrics: Utilize real Tohoku Electric Power Company financials for dependable valuation outcomes.
- Tailorable: Modify essential factors such as growth rates, WACC, and tax rates to align with your forecasts.
- Efficient: Built-in calculations save you the hassle of beginning from square one.
- Professional Quality: Crafted for investors, analysts, and consultants focusing on Tohoku Electric Power Company (9506T).
- Easy to Use: An intuitive design with step-by-step guidance ensures accessibility for all users.
Who Can Benefit from This Product?
- Investors: Evaluate Tohoku Electric Power Company's (9506T) valuation before making stock transactions.
- CFOs and Financial Analysts: Enhance valuation processes and validate financial projections.
- Startup Founders: Understand the valuation methodologies used for established companies like Tohoku Electric Power Company (9506T).
- Consultants: Create detailed valuation reports for your clients based on comprehensive analysis.
- Students and Educators: Utilize real-world data to practice and teach valuation strategies effectively.
What the Template Includes
- Pre-Filled Data: Features Tohoku Electric Power Company's historical financials and projections.
- Discounted Cash Flow Model: An editable DCF valuation model with automatic computation.
- Weighted Average Cost of Capital (WACC): A designated sheet for WACC calculations based on user-defined inputs.
- Key Financial Ratios: Assess Tohoku Electric's profitability, efficiency, and capital structure.
- Customizable Inputs: Easily modify revenue growth, profit margins, and tax rates.
- User-Friendly Dashboard: Visual charts and tables summarizing essential valuation outcomes.
Disclaimer
All information, articles, and product details provided on this website are for general informational and educational purposes only. We do not claim any ownership over, nor do we intend to infringe upon, any trademarks, copyrights, logos, brand names, or other intellectual property mentioned or depicted on this site. Such intellectual property remains the property of its respective owners, and any references here are made solely for identification or informational purposes, without implying any affiliation, endorsement, or partnership.
We make no representations or warranties, express or implied, regarding the accuracy, completeness, or suitability of any content or products presented. Nothing on this website should be construed as legal, tax, investment, financial, medical, or other professional advice. In addition, no part of this site—including articles or product references—constitutes a solicitation, recommendation, endorsement, advertisement, or offer to buy or sell any securities, franchises, or other financial instruments, particularly in jurisdictions where such activity would be unlawful.
All content is of a general nature and may not address the specific circumstances of any individual or entity. It is not a substitute for professional advice or services. Any actions you take based on the information provided here are strictly at your own risk. You accept full responsibility for any decisions or outcomes arising from your use of this website and agree to release us from any liability in connection with your use of, or reliance upon, the content or products found herein.