
|
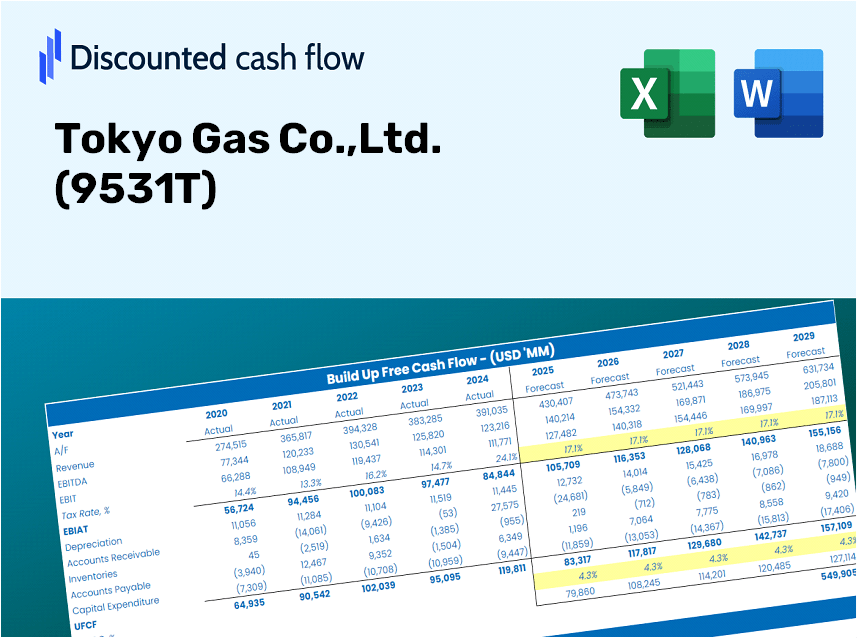
Tokyo Gas Co.,Ltd. (9531.T) DCF Valuation |
Fully Editable: Tailor To Your Needs In Excel Or Sheets
Professional Design: Trusted, Industry-Standard Templates
Investor-Approved Valuation Models
MAC/PC Compatible, Fully Unlocked
No Expertise Is Needed; Easy To Follow
Tokyo Gas Co.,Ltd. (9531.T) Bundle
Discover the true value of Tokyo Gas Co., Ltd. with our professional-grade DCF Calculator! Adjust key assumptions, explore various scenarios, and evaluate how changes influence Tokyo Gas Co., Ltd. valuation – all within a single Excel template.
Benefits of Using Our Template
- Adjustable Forecast Inputs: Seamlessly modify key variables (growth %, profit margins, WACC) to explore various scenarios.
- Real-World Data: Tokyo Gas Co., Ltd.'s financial information pre-loaded for quick analysis.
- Automated DCF Calculations: The template computes Net Present Value (NPV) and intrinsic value automatically.
- Professional and Tailorable: A refined Excel model designed to meet your valuation requirements.
- Designed for Analysts and Investors: Perfect for testing forecasts, corroborating strategies, and enhancing efficiency.
Key Features
- Comprehensive TG Data: Pre-loaded with Tokyo Gas's historical financial performance and future forecasts.
- Fully Customizable Inputs: Modify revenue growth, profit margins, WACC, tax rates, and capital expenditures as needed.
- Adaptive Valuation Model: Automatic recalculations of Net Present Value (NPV) and intrinsic value based on user inputs.
- Scenario Analysis: Develop various forecast scenarios to assess different valuation possibilities.
- User-Centric Interface: Intuitive, organized, and suitable for both experienced professionals and newcomers.
How It Functions
- Step 1: Download the Excel file.
- Step 2: Examine the pre-filled Tokyo Gas data (both historical and future projections).
- Step 3: Modify the key assumptions (highlighted in yellow) according to your analysis.
- Step 4: Observe the automatic updates for Tokyo Gas’s intrinsic value.
- Step 5: Utilize the results for investment strategies or reporting purposes.
Why Opt for This Calculator?
- Designed for Experts: A sophisticated tool favored by analysts, CFOs, and consultants.
- Accurate Data: Tokyo Gas Co., Ltd.'s historical and forecasted financials preloaded for reliability.
- Forecast Simulation: Easily test various scenarios and assumptions.
- Comprehensive Outputs: Automatically computes intrinsic value, NPV, and essential metrics.
- User-Friendly: Step-by-step guidance simplifies the process for everyone.
Who Should Use This Product?
- Investors: Accurately assess Tokyo Gas Co., Ltd.'s fair value (9531T) before making investment decisions.
- CFOs: Utilize a professional-grade DCF model for financial reporting and analysis specific to Tokyo Gas Co., Ltd. (9531T).
- Consultants: Efficiently customize the template for valuation reports for your clients featuring Tokyo Gas Co., Ltd. (9531T).
- Entrepreneurs: Acquire insights into financial modeling techniques employed by leading companies like Tokyo Gas Co., Ltd. (9531T).
- Educators: Employ this resource as a teaching aid to illustrate valuation methodologies relevant to Tokyo Gas Co., Ltd. (9531T).
Contents of the Template
- Preloaded TKGS Data: Historical and projected financial information, including revenue, EBIT, and capital expenditures.
- DCF and WACC Models: Advanced worksheets for calculating intrinsic value and the Weighted Average Cost of Capital.
- Editable Inputs: Cells highlighted in yellow for modifying revenue growth, tax rates, and discount rates.
- Financial Statements: Detailed annual and quarterly financials for in-depth analysis.
- Key Ratios: Ratios for profitability, leverage, and efficiency to assess performance.
- Dashboard and Charts: Visual representations of valuation results and assumptions.
Disclaimer
All information, articles, and product details provided on this website are for general informational and educational purposes only. We do not claim any ownership over, nor do we intend to infringe upon, any trademarks, copyrights, logos, brand names, or other intellectual property mentioned or depicted on this site. Such intellectual property remains the property of its respective owners, and any references here are made solely for identification or informational purposes, without implying any affiliation, endorsement, or partnership.
We make no representations or warranties, express or implied, regarding the accuracy, completeness, or suitability of any content or products presented. Nothing on this website should be construed as legal, tax, investment, financial, medical, or other professional advice. In addition, no part of this site—including articles or product references—constitutes a solicitation, recommendation, endorsement, advertisement, or offer to buy or sell any securities, franchises, or other financial instruments, particularly in jurisdictions where such activity would be unlawful.
All content is of a general nature and may not address the specific circumstances of any individual or entity. It is not a substitute for professional advice or services. Any actions you take based on the information provided here are strictly at your own risk. You accept full responsibility for any decisions or outcomes arising from your use of this website and agree to release us from any liability in connection with your use of, or reliance upon, the content or products found herein.