
|
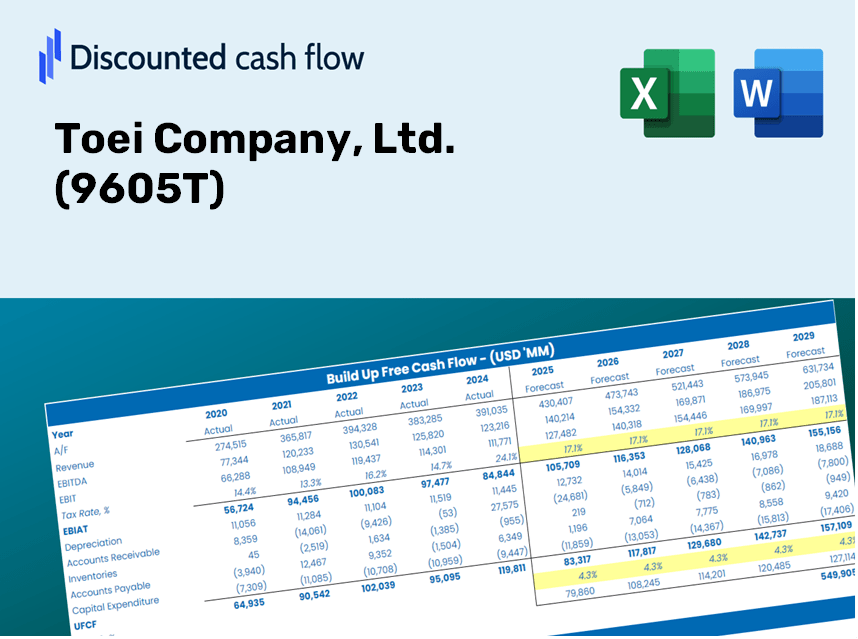
Toei Company, Ltd. (9605.T) DCF Valuation |
Fully Editable: Tailor To Your Needs In Excel Or Sheets
Professional Design: Trusted, Industry-Standard Templates
Investor-Approved Valuation Models
MAC/PC Compatible, Fully Unlocked
No Expertise Is Needed; Easy To Follow
Toei Company, Ltd. (9605.T) Bundle
Looking to determine Toei Company, Ltd.'s intrinsic value? Our (9605T) DCF Calculator integrates real-world data with extensive customization features, allowing you to refine your forecasts and enhance your investment choices.
Discounted Cash Flow (DCF) - (USD MM)
| Year | AY1 2020 |
AY2 2021 |
AY3 2022 |
AY4 2023 |
AY5 2024 |
FY1 2025 |
FY2 2026 |
FY3 2027 |
FY4 2028 |
FY5 2029 |
|---|---|---|---|---|---|---|---|---|---|---|
| Revenue | 107,648.0 | 117,539.0 | 174,358.0 | 171,345.0 | 179,922.0 | 207,273.1 | 238,781.9 | 275,080.6 | 316,897.3 | 365,070.8 |
| Revenue Growth, % | 0 | 9.19 | 48.34 | -1.73 | 5.01 | 15.2 | 15.2 | 15.2 | 15.2 | 15.2 |
| EBITDA | 21,514.0 | 25,837.0 | 42,146.0 | 39,165.0 | 43,783.0 | 46,981.0 | 54,122.8 | 62,350.4 | 71,828.6 | 82,747.7 |
| EBITDA, % | 19.99 | 21.98 | 24.17 | 22.86 | 24.33 | 22.67 | 22.67 | 22.67 | 22.67 | 22.67 |
| Depreciation | 3,597.0 | 3,494.0 | 3,421.0 | 3,665.0 | 4,330.0 | 5,315.2 | 6,123.2 | 7,054.0 | 8,126.3 | 9,361.6 |
| Depreciation, % | 3.34 | 2.97 | 1.96 | 2.14 | 2.41 | 2.56 | 2.56 | 2.56 | 2.56 | 2.56 |
| EBIT | 17,917.0 | 22,343.0 | 38,725.0 | 35,500.0 | 39,453.0 | 41,665.8 | 47,999.6 | 55,296.4 | 63,702.3 | 73,386.1 |
| EBIT, % | 16.64 | 19.01 | 22.21 | 20.72 | 21.93 | 20.1 | 20.1 | 20.1 | 20.1 | 20.1 |
| Total Cash | 68,516.0 | 81,631.0 | 93,614.0 | 105,182.0 | 105,448.0 | 127,175.6 | 146,508.3 | 168,780.0 | 194,437.2 | 223,994.8 |
| Total Cash, percent | .0 | .0 | .0 | .0 | .0 | .0 | .0 | .0 | .0 | .0 |
| Account Receivables | 20,116.0 | 23,713.0 | 37,892.0 | 38,849.0 | 43,710.0 | 44,588.8 | 51,367.0 | 59,175.6 | 68,171.3 | 78,534.4 |
| Account Receivables, % | 18.69 | 20.17 | 21.73 | 22.67 | 24.29 | 21.51 | 21.51 | 21.51 | 21.51 | 21.51 |
| Inventories | 13,393.0 | 19,644.0 | 18,757.0 | 17,332.0 | 15,822.0 | 24,384.0 | 28,090.8 | 32,361.1 | 37,280.5 | 42,947.7 |
| Inventories, % | 12.44 | 16.71 | 10.76 | 10.12 | 8.79 | 11.76 | 11.76 | 11.76 | 11.76 | 11.76 |
| Accounts Payable | 19,795.0 | 28,567.0 | 32,226.0 | 33,538.0 | 33,362.0 | 41,160.9 | 47,418.0 | 54,626.3 | 62,930.4 | 72,496.8 |
| Accounts Payable, % | 18.39 | 24.3 | 18.48 | 19.57 | 18.54 | 19.86 | 19.86 | 19.86 | 19.86 | 19.86 |
| Capital Expenditure | -3,718.0 | -7,664.0 | -5,531.0 | -5,094.0 | -8,276.0 | -8,589.1 | -9,894.7 | -11,398.9 | -13,131.7 | -15,127.9 |
| Capital Expenditure, % | -3.45 | -6.52 | -3.17 | -2.97 | -4.6 | -4.14 | -4.14 | -4.14 | -4.14 | -4.14 |
| Tax Rate, % | 60 | 60 | 60 | 60 | 60 | 60 | 60 | 60 | 60 | 60 |
| EBITAT | 7,328.2 | 9,003.6 | 15,069.8 | 14,006.5 | 15,779.4 | 16,629.9 | 19,157.9 | 22,070.2 | 25,425.3 | 29,290.3 |
| Depreciation | ||||||||||
| Changes in Account Receivables | ||||||||||
| Changes in Inventories | ||||||||||
| Changes in Accounts Payable | ||||||||||
| Capital Expenditure | ||||||||||
| UFCF | -6,506.8 | 3,757.6 | 3,326.8 | 14,357.5 | 8,306.4 | 11,714.1 | 11,158.5 | 12,854.8 | 14,808.9 | 17,060.1 |
| WACC, % | 5.05 | 5.05 | 5.05 | 5.05 | 5.05 | 5.05 | 5.05 | 5.05 | 5.05 | 5.05 |
| PV UFCF | ||||||||||
| SUM PV UFCF | 57,844.0 | |||||||||
| Long Term Growth Rate, % | 0.50 | |||||||||
| Free cash flow (T + 1) | 17,145 | |||||||||
| Terminal Value | 376,711 | |||||||||
| Present Terminal Value | 294,443 | |||||||||
| Enterprise Value | 352,287 | |||||||||
| Net Debt | -88,038 | |||||||||
| Equity Value | 440,325 | |||||||||
| Diluted Shares Outstanding, MM | 62 | |||||||||
| Equity Value Per Share | 7,112.22 |
Benefits You Will Receive
- Pre-Loaded Financial Model: Toei Company's actual data allows for accurate DCF valuation.
- Comprehensive Forecast Control: Modify revenue growth, profit margins, WACC, and other critical factors.
- Instantaneous Calculations: Automatic updates provide real-time results as you make adjustments.
- Professional-Grade Template: A polished Excel file crafted for high-quality valuation.
- Customizable and Reusable: Designed for versatility, enabling ongoing detailed forecasting.
Key Features
- Real-Life Toei Data: Pre-filled with Toei Company's historical financials and future projections.
- Fully Customizable Inputs: Modify revenue growth rates, profit margins, WACC, tax percentages, and capital expenditure estimates.
- Dynamic Valuation Model: Automatically recalculates Net Present Value (NPV) and intrinsic value based on your specified inputs.
- Scenario Testing: Generate various forecasting scenarios to evaluate different valuation results.
- User-Friendly Design: Intuitive, organized, and suitable for both professionals and newcomers.
How It Works
- Step 1: Download the Excel file for Toei Company, Ltd. (9605T).
- Step 2: Review the pre-filled financial data and forecasts for Toei Company.
- Step 3: Adjust key inputs such as revenue growth, WACC, and tax rates (highlighted cells).
- Step 4: Observe the DCF model refresh in real-time while modifying your assumptions.
- Step 5: Evaluate the outputs and utilize the findings for your investment strategies.
Why Opt for This Calculator?
- Accurate Data: Utilize real financials from Toei Company, Ltd. (9605T) for trustworthy valuation outcomes.
- Customizable: Modify essential variables such as growth rates, WACC, and tax rates to align with your forecasts.
- Time-Saving: Pre-configured calculations save you the effort of starting from the ground up.
- Professional-Grade Tool: Tailored for use by investors, analysts, and consultants.
- User-Friendly: An intuitive interface with clear, step-by-step guidance makes it accessible for everyone.
Who Can Benefit from This Product?
- Film and Animation Students: Master the art of storytelling and character development using real-world examples from Toei Company, Ltd. (9605T).
- Researchers: Utilize professional case studies and models in your academic projects or publications.
- Investors: Validate your investment strategies and evaluate the performance metrics for Toei Company, Ltd. (9605T).
- Market Analysts: Optimize your analytical processes with a fully customizable valuation model.
- Content Creators: Discover how major entertainment companies like Toei Company, Ltd. (9605T) are analyzed and their market impact.
Contents of the Template
- Pre-Filled Data: Contains Toei Company, Ltd.'s historical financial figures and forecasts.
- Discounted Cash Flow Model: An editable DCF valuation model featuring automatic calculations.
- Weighted Average Cost of Capital (WACC): A dedicated worksheet for calculating WACC using custom inputs.
- Key Financial Ratios: Evaluate Toei Company's profitability, operational efficiency, and financial leverage.
- Customizable Inputs: Easily modify revenue growth, profit margins, and tax rates.
- Clear Dashboard: Visual charts and tables summarizing essential valuation outcomes.
Disclaimer
All information, articles, and product details provided on this website are for general informational and educational purposes only. We do not claim any ownership over, nor do we intend to infringe upon, any trademarks, copyrights, logos, brand names, or other intellectual property mentioned or depicted on this site. Such intellectual property remains the property of its respective owners, and any references here are made solely for identification or informational purposes, without implying any affiliation, endorsement, or partnership.
We make no representations or warranties, express or implied, regarding the accuracy, completeness, or suitability of any content or products presented. Nothing on this website should be construed as legal, tax, investment, financial, medical, or other professional advice. In addition, no part of this site—including articles or product references—constitutes a solicitation, recommendation, endorsement, advertisement, or offer to buy or sell any securities, franchises, or other financial instruments, particularly in jurisdictions where such activity would be unlawful.
All content is of a general nature and may not address the specific circumstances of any individual or entity. It is not a substitute for professional advice or services. Any actions you take based on the information provided here are strictly at your own risk. You accept full responsibility for any decisions or outcomes arising from your use of this website and agree to release us from any liability in connection with your use of, or reliance upon, the content or products found herein.