
|
Tianqi Lithium Corporation (9696.HK): PESTLE Analysis [Apr-2026 Updated] |
Fully Editable: Tailor To Your Needs In Excel Or Sheets
Professional Design: Trusted, Industry-Standard Templates
Investor-Approved Valuation Models
MAC/PC Compatible, Fully Unlocked
No Expertise Is Needed; Easy To Follow
Tianqi Lithium Corporation (9696.HK) Bundle
Tianqi Lithium sits at the center of the EV supply chain with world-class assets (Greenbushes stake, Kwinana refinery), advanced processing and recycling initiatives, and strong exposure to booming Chinese NEV demand - yet its earnings hinge on volatile lithium prices and a risky dependence on SQM dividends amid sweeping Chilean, Australian and US policy shifts; technological advances like DLE and solid‑state batteries offer upside to lower costs and boost long‑term demand, but mounting royalties, trade barriers, water and ESG constraints, and labor and legal costs threaten margins and growth, making Tianqi's next strategic moves critical to whether it capitalizes on opportunity or is hemmed in by geopolitics and regulation.
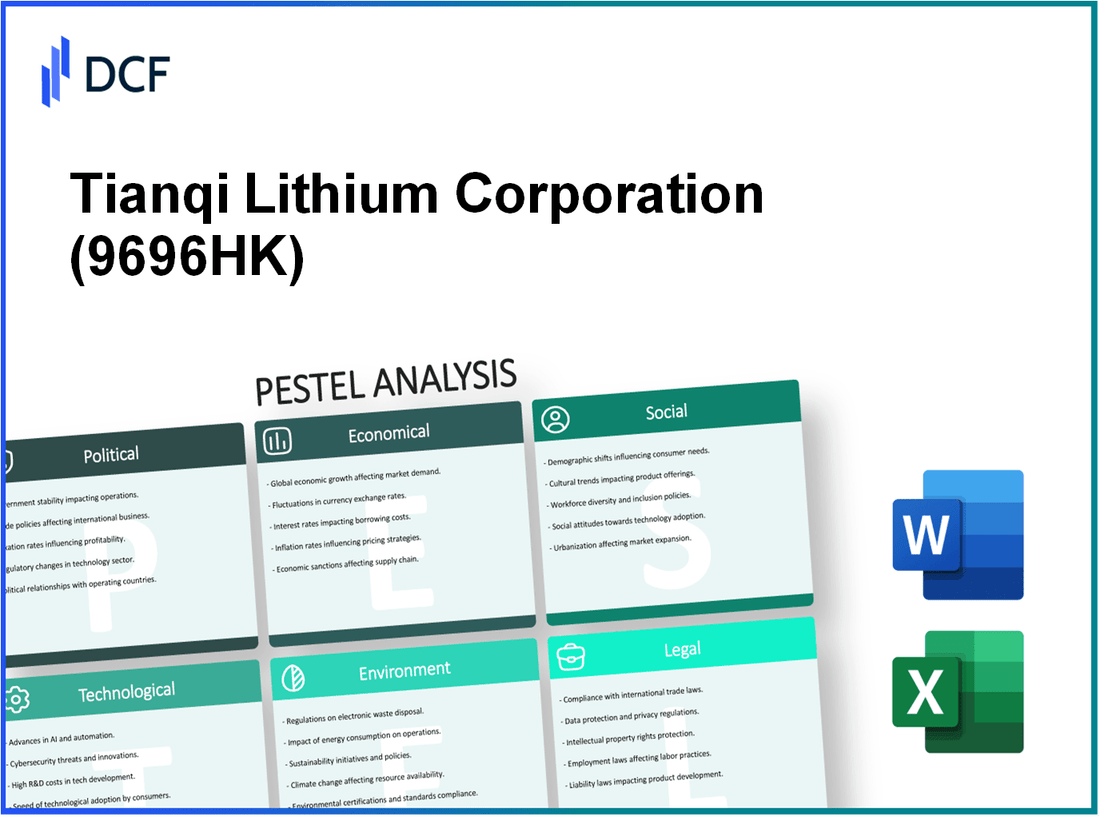
Tianqi Lithium Corporation (9696.HK) - PESTLE Analysis: Political
Chile moves to 50.01% state-controlled SQM-Codelco partnership in 2031: The Chilean government's announced plan to create a state-controlled entity holding 50.01% of the merged SQM-Codelco lithium operations by 2031 materially alters the competitive landscape. The transaction envisions consolidation of ~350,000-400,000 tpa Li2CO3-equivalent combined capacity (current combined ~200,000-250,000 tpa with planned expansions), giving the state entity de facto pricing and export influence over the world's largest proven brine resources. For Tianqi - with direct exposure via its ~23% holding in SQM historically and via supply contracts - this increases sovereign counterparty risk, potential renegotiation of offtake terms, and market share pressure as a large state-backed producer targets prioritized domestic industrial supply and strategic reserves.
Tax and royalty regime in Chile heightens profitability pressure: Recent Chilean proposals and enacted measures include higher mining royalties, special levies on lithium rents, and accelerated taxation on resource super-profits. Legislative drafts discussed effective royalty rates rising from typical mining royalties of 5-20% to resource-specific levies that could increase after-tax project IRR erosion of 150-800 basis points depending on price scenarios. Chile's 2023-2025 fiscal policy packages projected additional state revenue from mineral taxation of USD 1.2-2.0 billion annually under high-price scenarios, directly compressing margins for upstream producers and reducing incentive for greenfield investment.
| Political Factor | Direct Impact on Tianqi | Quantitative Indicator | Timeframe |
|---|---|---|---|
| Chile state control of SQM-Codelco | Increased market concentration; renegotiation risk of offtakes; price influence | 50.01% state stake; combined capacity est. 350,000-400,000 tpa Li2CO3-eq | Implementation by 2031 |
| Higher royalties/taxes | Reduced netbacks; lower project NPV and IRR | Royalty increases: +0-15 ppt; IRR impact: -1.5% to -8.0% | Effective 2023-2027 (phased) |
| Lithium as non-concessional mineral | Limits private concessions; increases state approval controls | Legislative classification: non-concessional; affects ~60-80% of brine basins | Constitutional/legislative change effective 2024-2026 |
| Australia screening of critical minerals investments | Heightened approval scrutiny for Chinese capital; longer M&A timetables | FDI review volume +30% YoY; median decision time +45 days | Policy tightened 2022-ongoing |
| US protectionist policies | Constrains direct access to North American projects and incentives | CHI-related approvals declined ~25% in critical mineral projects (2022-24) | Inflation Reduction Act and related measures from 2022-ongoing |
Lithium designated non-concessional mineral under constitution: Constitutional and statutory reforms in Chile have moved toward treating lithium as a strategic, non-concessional mineral, meaning new exploration and extraction rights cannot be granted via conventional mining concessions. This reclassification affects tenure security for private firms, placing existing and prospective brine projects under extraordinary administrative approvals and limiting acreage availability. Quantitatively, analysts estimate that up to 60-80% of prospective brine tracts are now either off-limits for new concessions or require bespoke state agreements, reducing Chilean greenfield opportunity sets by an estimated 30-50% relative to pre-reform baselines.
Australian critical minerals screening tightens Chinese investment: Australia's foreign investment rules and critical minerals screening mechanisms have been strengthened to protect supply chains for lithium and related battery precursors. For Tianqi, which has major assets and JV exposure in Australia (including the Kwinana processing and the Greenbushes-related interests through partners), this manifests as longer, more conditional approvals for transactions, greater divestment pressure in sensitive assets, and additional compliance costs. Metrics: average FDI review timelines in critical minerals increased by ~45 days (median), conditional approvals rose by ~18% between 2021 and 2024, and foreign-ownership limitation proposals target certain upstream and processing assets.
- Average FDI review delay: +45 days (critical minerals, 2021-2024)
- Conditional approvals increase: +18% (2021-2024)
- Estimated compliance cost uplift: 0.5-1.2% of asset value for major transactions
US protectionist policies constrain Tianqi's North American supply potential: The US Inflation Reduction Act (IRA) and accompanying critical minerals policies provide incentives for domestic battery and EV supply chains while restricting credits where Chinese-origin materials or foreign entities are involved. Tianqi faces restricted access to incentive pools, elevated national security reviews for investments, and potential exclusion from subsidized offtake agreements. Financial implications include foregone incentive pools potentially worth hundreds of millions USD annually; e.g., a hypothetical 100 ktpa Li2CO3-equivalent supply into qualifying US battery supply chains could forego USD 200-500 million in cumulative tax credits/subsidies over a 5-7 year span if Chinese links disqualify the supplier.
Operational and contractual impacts - summarized actions and exposures:
- Contract renegotiation risk: offtake prices and volumes may be renegotiated if counterparties shift to state-favored suppliers; estimated potential revenue variance: ±5-15% annually for affected contracts.
- Asset impairment risk: classification and royalty changes could reduce Chilean asset NPVs by an estimated 10-30% under base-case lithium prices (USD 12,000-18,000/t Li2CO3-eq).
- Deal execution risk: cross-border M&A involving Tianqi may see approval timelines extended by 30-60%, increasing transaction costs and financing spreads by ~25-75 bps.
Tianqi Lithium Corporation (9696.HK) - PESTLE Analysis: Economic
Lithium price volatility drives margin sensitivity. Benchmark lithium carbonate and spodumene prices swung widely from 2020-2024: spodumene concentrate (6% Li2O) reached peaks above US$3,000-4,000/t in 2021 then corrected to below US$800-1,200/t in 2022-2023; battery-grade lithium carbonate ranged from ~US$6,000/t at peaks to ~US$8,000-10,000/t in episodic rebounds and down to US$10,000-15,000/t depending on region and grade in 2024 price windows. Tianqi's gross margin and EBITDA were highly correlated with realized product mix and contracted vs. spot sales; a ±20-30% shift in realized lithium prices can move operating margins by double-digit percentage points given concentrated upstream exposure.
Surplus lithium supply expected to late 2025. Industry supply modelling (plant commissioning schedules and announced expansions through 2025) implies a cumulative incremental upstream supply of ~400-600 kt LCE (lithium carbonate equivalent) 2023-2025, driven by new hard-rock spodumene and expanded brine capacity. Consensus forecasts in 2023-mid‑2024 projected an oversupply emerging in late‑2024 to 2025, exerting downward price pressure of 30-60% from peak levels if demand growth moderates. For Tianqi, increased spodumene volumes from Australian and African projects compress realized prices for concentrate and pressure conversion margins.
China macro demand supports industrial lithium use. China accounted for ~60-70% of global EV battery demand and ~50-60% of global battery chemical consumption through 2023-2024. EV sales in China reached ~6-7 million units annually 2022-2023 with compounded annual growth rates (CAGR) of 25-40% in previous years; policy incentives, fleet electrification targets and industrial electrification sustain base industrial demand for lithium compounds even under price correction scenarios. Tianqi's downstream processing exposure in China (conversion plants and joint ventures) captures domestic battery supply chain demand and benefit from proximity to OEMs and cathode producers.
Hedging and currency exposure add cost. Tianqi's revenues and input costs span USD, AUD, and CNY. Key exposures include:
- Sales denominated partially in USD and RMB while concentrate sales often priced in USD-linked benchmarks.
- Operating costs in AUD for Australian mining assets and CNY for Chinese processing, creating transaction and translation risk; FX swings (e.g., 10% AUD/USD move) materially affect reported margins in HKD terms.
- Hedging programs (for price and FX) are used but are costly: option premiums, forward contract margins and collateral requirements reduce near-term cash flow flexibility-estimated hedging cost can reach 1-3% of revenue annually depending on strategy intensity.
Global capital expenditure in lithium activity remains robust. Announced upstream and downstream CAPEX globally was estimated at US$20-40 billion cumulatively for 2023-2026 across majors, juniors and Chinese converters, supporting long‑term capacity build-out despite near-term cyclical weakness. Tianqi's own capital commitments and JV investments include:
- Ongoing project CAPEX commitments in processing and conversion estimated in the hundreds of millions to low billions USD per major facility.
- Debt-funded and equity-funded expansions: leverage and interest cost sensitivity-each 100 bp rise in interest rates can increase finance expense by tens of millions USD annually on incremental borrowings.
- Working capital swings tied to inventory and receivables: inventory build during low-price periods ties up cash and may increase short‑term funding needs by hundreds of millions HKD.
Key economic indicators and metrics relevant to Tianqi (illustrative consolidated view):
| Indicator | Recent Value / Range | Implication for Tianqi |
|---|---|---|
| Spodumene Concentrate Price (6% Li2O) | US$800-4,000/t (2021-2024 observed swings) | Direct impact on upstream revenue and spot sales margin volatility |
| Battery-grade Li2CO3 Price | US$6,000-15,000/t (grade and region dependent) | Affects downstream conversion margin and contract renegotiations |
| Estimated Additional Global LCE Supply (2023-2025) | ~400-600 kt LCE | Potential to create oversupply and price compression |
| China EV Demand Share | ~60-70% of global battery demand | Supports domestic conversion demand for Tianqi's Chinese assets |
| Global Lithium CAPEX (2023-2026 Announced) | US$20-40 billion | Maintains expansion momentum; increases competition |
| Hedging Cost Estimate | ~1-3% of revenue pa (strategy-dependent) | Reduces cash flow; stabilizes earnings volatility |
| FX Exposure | USD/AUD/CNY mix; ±10% moves significant | Translation risk; requires active treasury management |
| Leverage Sensitivity | Each 100 bp rate rise → tens of millions USD interest on incremental debt | Higher finance costs strain free cash flow during price downturns |
Economic implications for operations and strategy:
- Revenue and EBITDA remain highly price-sensitive; contract mix (long-term vs spot) is a key risk control.
- Timing of expansion capex and ramp-up matters: commissioning into a surplus cycle can prolong low-price periods.
- Active FX and price hedging reduce headline volatility but add quantifiable costs and collateral demands.
- China's sustained battery demand provides a demand floor for downstream assets, supporting conversion asset utilization even if concentrate prices adjust downward.
Tianqi Lithium Corporation (9696.HK) - PESTLE Analysis: Social
Rapid EV adoption drives battery demand: Global electric vehicle (EV) stock surpassed 26 million units in 2023, with year-on-year growth ~40%. China accounted for ~60% of global EV sales in 2023. For Tianqi Lithium, a conservative demand projection implies lithium carbonate-equivalent (LCE) demand growth of 20-30% annually in major markets over the next 3-5 years, translating into incremental LCE requirement of ~200-350 ktpa by 2028 from 2023 base demand levels. Increased upstream pricing pressure historically correlated with EV uptake has driven lithium prices volatility: LCE spot ranges from ~US$10,000/t to peaks above US$70,000/t in recent cycles, materially affecting revenue for producers and refiners.
Skilled labor shortages raise production costs: China and Australia face shortages in chemical processing engineers, metallurgists, and high-skill technicians. Reported vacancy-to-hire ratios in mining/metallurgy sectors rose to ~1.2 in 2022-2024 in key regions, pushing average hourly wages for skilled technicians up 8-15% year-over-year. For Tianqi, labour-driven OPEX pressure can add an estimated US$10-40/tonne LCE depending on automation levels and local wage inflation; capital expenditure to automate and train can require CAPEX uplift of US$50-200 million per major expansion project.
Indigenous rights require profit-share and social licenses: Projects in Australia, Chile, and other jurisdictions often include Indigenous land claims or community benefit agreements. Typical profit-share/community benefits range from 1-5% of project EBITDA or structured royalty equivalents of US$0.5-5.0/tonne LCE. Failure to secure agreements can lead to injunctions; approval timelines can lengthen by 12-36 months and legal/social mitigation can cost US$20-150 million depending on project scale. Tianqi's asset footprint necessitates proactive engagement and budget allocation for negotiated benefits and long-term community funds (multi-year commitments often exceeding US$10-50 million for large projects).
Urban mobility trends increase micro-mobility battery demand: Micro-mobility (e-bikes, scooters) market size reached ~US$XX billion in 2024 (global e-bike sales >50 million units in 2023), creating demand for smaller-format lithium-ion cells and integrated battery packs. This diversifies demand away from large-format automotive cells and supports higher-margin specialty chemistries. For Tianqi, capture of 1-3% of global micro-mobility LCE demand could equate to ~10-30 kt LCE annually, with gross margins potentially 3-8 percentage points higher than commodity-grade LCE when integrated into higher-value downstream cell/pack projects.
Social opposition can raise approval timelines and costs: Public protests, NGO campaigns, and activist shareholders can increase permitting timelines and impose remediation obligations. Empirical cases show that high-profile opposition prolongs permitting by 6-48 months and can add remediation or compliance costs of US$5-300 million. Reputational incidents can also affect off-take contracting and financing terms: lenders may impose social performance covenants or higher margins; bond spreads for mining firms with unresolved social conflicts can widen by 50-200 basis points, increasing annual financing costs by US$1-10 million for mid-sized capital structures.
| Social Factor | Key Metrics / Estimates | Impact on Tianqi (financial & operational) |
|---|---|---|
| EV adoption | Global EV stock 26M (2023); Y/Y growth ~40%; China ~60% of sales | Incremental LCE demand +200-350 ktpa by 2028; price volatility impacts revenue ±US$10k-60k/t LCE |
| Skilled labor shortages | Vacancy ratio ~1.2; wage inflation 8-15% for specialists | OPEX increase US$10-40/t LCE; required CAPEX for automation/training US$50-200M per project |
| Indigenous/community agreements | Profit-share 1-5% EBITDA or US$0.5-5/t LCE; delay 12-36 months | Upfront & ongoing costs US$20-150M; legal/permit delays impacting revenue timing |
| Micro-mobility demand | Global e-bike sales >50M (2023); micro-mobility market growing mid-teens % p.a. | Potential capture 10-30 kt LCE; higher gross margins +3-8 pp vs commodity LCE |
| Social opposition / activism | Permitting delays 6-48 months; remediation cost US$5-300M; financing spread +50-200 bps | Increased capex and working capital needs; higher financing costs US$1-10M p.a. for mid-sized firms |
Implications for risk management and operations:
- Allocate contingency budgets: set aside US$20-150M per major project for social mitigation and benefit programs.
- Invest in local workforce development: training pipelines to reduce vacancy ratios and cap wage inflation exposure.
- Negotiate transparent benefit-sharing: target community royalties and multi-year funds in line with 1-5% EBITDA equivalents.
- Diversify product mix: pursue micro-mobility and specialty battery chemistries to capture higher-margin demand segments.
- Strengthen stakeholder engagement: continuous consultation to reduce approval delays from potential 12-36 months to single-digit months where feasible.
Tianqi Lithium Corporation (9696.HK) - PESTLE Analysis: Technological
DLE achieves high recovery, reshaping cost curve: Tianqi's selective adoption of direct lithium extraction (DLE) technologies pushes recovery rates from traditional brine evaporation benchmarks of 40-60% to DLE-level recoveries of 80-95% depending on feed chemistry and process configuration. In pilot deployments Tianqi reports typical incremental recovery gains of 25-40 percentage points and estimated operating cost reductions of 10-30% per tonne LCE (lithium carbonate equivalent) versus slow pond-based operations due to lower water footprint and cycle time, materially compressing the industry cost curve and reducing breakeven price for marginal resources.
| Technology | Typical Recovery | Cycle Time | Estimated Opex Reduction vs Ponds | Water Use |
|---|---|---|---|---|
| Conventional Brine Ponds | 40-60% | 12-18 months | Baseline | High (evaporation-dependent) |
| Ion-Exchange DLE | 75-90% | 1-4 weeks | 15-30% | Low (closed-loop) |
| Membrane/Adsorption DLE | 80-95% | 1-8 weeks | 10-25% | Low |
Solid-state BATTERY development requires more lithium uptake: Global momentum toward solid-state batteries (SSBs) in EVs and grid storage raises long-term lithium intensity assumptions. Compared with current liquid-electrolyte NMC chemistries that average ~0.8-1.0 kg LCE per kWh at cell level, commercial SSB roadmaps imply 10-20% higher active lithium content per kWh due to different electrode designs and safety margins. Market projections by major OEM partnerships suggest SSB adoption scenarios (2030-2040) could increase cumulative lithium demand by 5-25 Mt LCE versus baseline forecasts; for Tianqi this elevates revenue upside given its refined chemicals and converter capacity (current annual spodumene concentrate processing >1.0 Mt and chemical capacity ~100 kt LCE-equivalent in mid-term expansion plans).
Recycling tech raises supply security and lowers primary demand: Advances in mechanical, hydrometallurgical and direct recycling processes (including closed-loop cathode relithiation) are increasing secondary-supply penetration. Industry recycling recovery rates for cobalt, nickel and lithium are moving from 50-70% to 80-95% for nickel/cobalt and toward 60-85% for lithium depending on process. Scenario modelling shows recycling could supply 15-30% of lithium demand by 2035 under accelerated collection policies, exerting downward pressure on primary prices and compelling Tianqi to integrate recycled feedstock sourcing or invest in recycling JV(s) to secure margin and feedstock flexibility.
| Recycling Process | Lithium Recovery | Typical Feedstock | Capex Range (USD) | Time to Scale |
|---|---|---|---|---|
| Hydrometallurgical | 60-85% | End-of-life cathodes, black mass | 20-80 million | 2-4 years |
| Direct Recycling | 70-90% | Intact cathode powders | 30-100 million | 3-5 years |
| Mechanical Pre-Processing | 15-50% (pre-step) | Battery packs, modules | 5-30 million | 1-3 years |
Automation and digital twins boost efficiency and purity: Tianqi's digitization roadmap targets plant-level automation, process control upgrades and digital twin deployment across mining, concentrator and chemical conversion assets. Expected KPI improvements include throughput increases of 5-20%, reagent consumption reductions of 8-15%, product purity consistency lift to ±0.5% for battery-grade Li2CO3/LiOH, and downtime reduction of 10-40% through predictive maintenance. Capital efficiency improves as unit cash cost per tonne LCE can decline by 3-12% post-implementation, while quality improvements reduce penalty events in offtake contracts.
- Throughput uplift: 5-20% per plant
- Reagent savings: 8-15%
- Downtime reduction via predictive maintenance: 10-40%
- Purity variance tightened to ±0.5% for battery-grade products
Innovation protects leading position via IP and patents: Tianqi's R&D and strategic partnerships accumulate proprietary process IP across DLE sorbents, hydrometallurgical circuits, and purification chemistries. Public patent filings and in-house innovations create barriers: consolidated counts among large producers and licensors show 200-600 patent families relevant to lithium extraction and refining globally. For Tianqi, defensible IP supports margin capture through licensing, long-term supply contracts and deterrence of low-cost entrants replicating advanced processes. R&D spend as percentage of revenues for leading integrated players ranges 1-4%; Tianqi's targeted R&D allocation of 1.5-3% supports iterative improvements and patent portfolio growth.
- Estimated relevant patent families (global market): 200-600
- R&D spend as % of revenue (peer range): 1-4%
- Tianqi targeted R&D allocation: 1.5-3% of revenue
- Potential licensing revenue/impact: incremental 1-5% EBITDA upside in select scenarios
Tianqi Lithium Corporation (9696.HK) - PESTLE Analysis: Legal
Mining royalties and tax regimes fluctuate across jurisdictions, affecting Tianqi's unit operating costs and project economics. In Western Australia, royalties for spodumene concentrate are typically 5%-7% of gross value; in Chile and Argentina royalty regimes range from 3% to 8% depending on resource and production thresholds. A 1% increase in effective royalty rate can reduce mine-level EBITDA margin by ~2-3 percentage points for hard-rock projects with concentrate prices at US$8,000-12,000/tonne Li2O equivalent. Fiscal stability clauses in concession contracts remain critical: projects with 15-25 year mine lives often seek fixed royalty floors or step-up mechanisms to preserve NPV against fiscal volatility.
ESG disclosure mandates increase compliance overhead. Mandatory climate-related financial disclosures (TCFD/ISSB alignment), EU CSRD (for entities selling into EU), and China's expanding mandatory disclosure pilots require enhanced data collection, assurance, and reporting systems. Expected compliance cost: initial implementation US$1.5-4.0 million for mid-cap miners; recurring annual costs 0.1%-0.3% of revenue for complex operations. Non-financial reporting exposure includes potential fines (up to 2%-5% of annual turnover under some jurisdictions), delisting risk from stock exchanges for late or inaccurate reporting, and reputational damages affecting offtake pricing.
Trade remedies and tariffs constrain export volumes. Anti-dumping and countervailing duties, export controls on critical minerals, and quota systems can materially reduce access to end markets. Example: hypothetical imposition of a 10% export tariff on spodumene concentrate to a key destination could reduce realized FOB revenue by ~8% after freight adjustments. Historical precedent: tariffs and trade restrictions on steel and rare earths led to 5%-15% volume re-routing and incremental logistics costs of US$10-30/tonne. Tariff uncertainty increases working capital needs by extending contract negotiation timelines and limiting long-term offtake certainty.
IP protection and punitive damages influence R&D strategy. Patent enforcement environments vary: China, Australia, EU and US patent frameworks provide differing protection scopes for lithium processing technologies (e.g., extraction, refining, cathode precursor processes). Weak IP enforcement or risk of high punitive damages in certain jurisdictions leads Tianqi to favor trade secrets, tighter data protection, and selective patent filings. R&D spend allocation: Tianqi's group-level R&D intensity historically ~1%-2% of revenue; adjustments toward protective measures may raise effective R&D-related legal and administrative spend by 10%-30% annually.
Global tax reforms raise international tax compliance costs. OECD BEPS 2.0 Pillar One and Pillar Two (minimum effective tax rate 15%) create shift in multinational tax base allocation and potential top-up taxes. For a global miner with manufacturing and refining footprints, the Pillar Two minimum tax could increase consolidated effective tax rates by 1-4 percentage points depending on jurisdictional profit mix. Compliance requires transfer-pricing documentation, country-by-country reporting (CbCR), and tax provisioning updates. One-off system implementation cost estimates: US$2-6 million for medium-sized integrated miners; ongoing incremental tax expense depends on jurisdictional profit reallocation and could amount to tens of millions USD for large taxable bases.
| Legal Risk | Typical Impact | Quantitative Example | Mitigation |
|---|---|---|---|
| Royalty & Tax Regime Changes | Higher unit costs, lower NPV | +1% royalty → EBITDA margin -2-3 ppt | Fiscal stability clauses, tax hedging, jurisdictional diversification |
| ESG Disclosure Mandates | Compliance costs, penalties, delisting risk | Implementation US$1.5-4.0M; fines up to 2-5% turnover | Invest in assurance, integrated reporting, third-party audits |
| Trade Remedies & Tariffs | Reduced exports, margin compression | 10% tariff → ~8% realized revenue loss | Supply-chain diversification, local processing, trade litigation readiness |
| IP Protection & Damages | Higher R&D legal costs, constrained technology transfer | R&D admin +10-30% annually | Patent portfolio strategy, trade secret policies, jurisdictional filings |
| Global Tax Reforms (BEPS 2.0) | Higher effective tax rate, compliance burden | Pillar Two could raise ETR by 1-4 ppt; implementation US$2-6M | Tax planning, transfer-pricing alignment, CbCR readiness |
Key compliance and legal actions Tianqi should prioritize:
- Negotiate fiscal stability clauses and periodic reviews in mining contracts;
- Invest US$1.5-5M in ESG reporting systems and obtain third-party assurance within 12-24 months;
- Establish trade-monitoring unit to model tariff scenarios and hedging strategies;
- Strengthen IP strategy: selective patents + robust trade secret protection, legal reserves for infringement litigation;
- Implement BEPS 2.0 readiness: update transfer-pricing policies, deploy global tax compliance software, allocate US$2-6M for initial rollout.
Tianqi Lithium Corporation (9696.HK) - PESTLE Analysis: Environmental
Tianqi operates across hard‑rock (spodumene concentrate) and brine‑linked value chains, exposing the company to environmental constraints that materially affect output, cost and capital allocation.
Water scarcity and brine constraints limit output
Tianqi's extraction footprint intersects water‑stressed basins and regions with competing agricultural and municipal demand. Estimated freshwater / process water use intensity ranges by feedstock: hard‑rock spodumene processing requires roughly 0.5-2.0 m3 per tonne of ore processed (process-dependent), while brine extraction operations in salar environments can rely on surface and groundwater interactions with effective water‑consumptive rates often reported as 0.1-0.5 m3 per kg LCE equivalent (industry estimates). Regional constraints lead to production caps, seasonal curtailments and water‑allocation fees. Reported or modeled figures relevant to Tianqi exposures:
| Parameter | Estimated range | Impact on Tianqi |
|---|---|---|
| Process water - spodumene concentrator | 0.5-2.0 m3/tonne ore | Higher utility and treatment cost; limits scaling in arid sites |
| Brine water consumption (effective) | 0.1-0.5 m3/kg LCE | Constrains pumping volumes and licence renewals |
| Regional water stress score (examples) | Atacama Basin: >0.8 (high); Western Australia: 0.3-0.6 (moderate) | Licence stringency and stakeholder scrutiny differ by asset |
Emission reductions require massive green investment
Tianqi's carbon footprint differs by feedstock: hard‑rock mining and milling are energy‑intensive (mining fleet, crushing, concentrators, thermal processes), whereas brine operations have higher indirect emissions from evaporation ponds and pump energy. Typical industry emission intensity estimates: spodumene concentrate 4-12 tCO2e per t LCE equivalent; brine/LCE pathways 2-8 tCO2e per t LCE. Meeting net‑zero or Scope 1/2 reduction targets implies capital deployment into electrification, renewables and efficiency:
- CapEx to electrify fleet and process heat: estimated US$50-300 per tonne annual capacity incremental, depending on retrofit complexity.
- Onsite renewables and storage to offset grid electricity: 20-60% reduction in Scope 2 emissions achievable with 5-15 MW per 100 ktpa concentrator scale (depending on insolation/wind).
- Carbon price sensitivity: a hypothetical US$50/tCO2e increases operating cost by US$200-600 per t LCE (based on 4-12 tCO2e/t LCE range).
Biodiversity offsets and habitat laws extend project timelines
Stringent permitting and biodiversity compensation requirements in Australia, South America and China increase lead times and add development cost. Typical impacts documented in industry permitting:
| Requirement | Typical timeline addition | Cost implication |
|---|---|---|
| Environmental Impact Assessment (EIA) + public consultation | 6-24 months | US$0.5-5 million for major projects |
| Biodiversity offsets / restoration plans | Parallel to EIA; multi‑year obligations | US$0.5-10 million depending on habitat value |
| Protected species mitigation and monitoring | Ongoing (5-20 years) | Annual monitoring US$50k-500k per site |
Tailings and waste regulation drive cost per tonne
Heightened scrutiny of tailings storage facilities (TSFs), waste rock and chemical residues raises compliance and insurance costs. Industry metrics and implications for Tianqi:
- Tailings management capex: engineered dry‑stacking conversion can add US$5-30 per tonne processed incremental Opex/Capex amortised.
- Rehabilitation bonds and financial assurance: regulators increasingly require upfront guarantees representing 1-5% of project capex; for a US$500m expansion, bonds could be US$5-25m.
- Insurance and financing margins: lenders may apply environmental covenants and margin premiums (10-50 bps) tied to TSF standards.
Renewable energy adoption lowers emissions and energy costs
Deployment of solar, wind and grid‑scale batteries at mine sites materially reduces Scope 2 emissions and stabilises power price exposure. Practical outcomes observed in comparable operations:
| Renewable solution | Typical project scale | Emissions reduction | Energy cost impact |
|---|---|---|---|
| Utility‑scale solar + BESS | 5-50 MW | 20-60% Scope 2 reduction | Levelised energy cost reduction 10-40% |
| Wind farm PPAs | 10-100 MW | 20-70% Scope 2 reduction | Stabilises cost; potential 5-30% savings vs volatile grid |
| Electrified onsite heating/process heat | Depends on process (MW thermal) | Direct Scope 1 reduction when paired with renewables | CapEx‑intensive but Opex decreases with low‑cost renewables |
Operational and capital priorities for Tianqi implied by the above environmental drivers include water‑efficient processing, accelerated investment in renewables and electrification, enhanced tailings/rehab provisioning, and longer permitting timelines tied to biodiversity mitigation. Quantitative planning should incorporate sensitivity to water‑allocation changes, carbon pricing (US$0-100/tCO2e scenarios), and renewable P50/P90 generation profiles when modelling unit costs and production schedules.
Disclaimer
All information, articles, and product details provided on this website are for general informational and educational purposes only. We do not claim any ownership over, nor do we intend to infringe upon, any trademarks, copyrights, logos, brand names, or other intellectual property mentioned or depicted on this site. Such intellectual property remains the property of its respective owners, and any references here are made solely for identification or informational purposes, without implying any affiliation, endorsement, or partnership.
We make no representations or warranties, express or implied, regarding the accuracy, completeness, or suitability of any content or products presented. Nothing on this website should be construed as legal, tax, investment, financial, medical, or other professional advice. In addition, no part of this site—including articles or product references—constitutes a solicitation, recommendation, endorsement, advertisement, or offer to buy or sell any securities, franchises, or other financial instruments, particularly in jurisdictions where such activity would be unlawful.
All content is of a general nature and may not address the specific circumstances of any individual or entity. It is not a substitute for professional advice or services. Any actions you take based on the information provided here are strictly at your own risk. You accept full responsibility for any decisions or outcomes arising from your use of this website and agree to release us from any liability in connection with your use of, or reliance upon, the content or products found herein.