
|
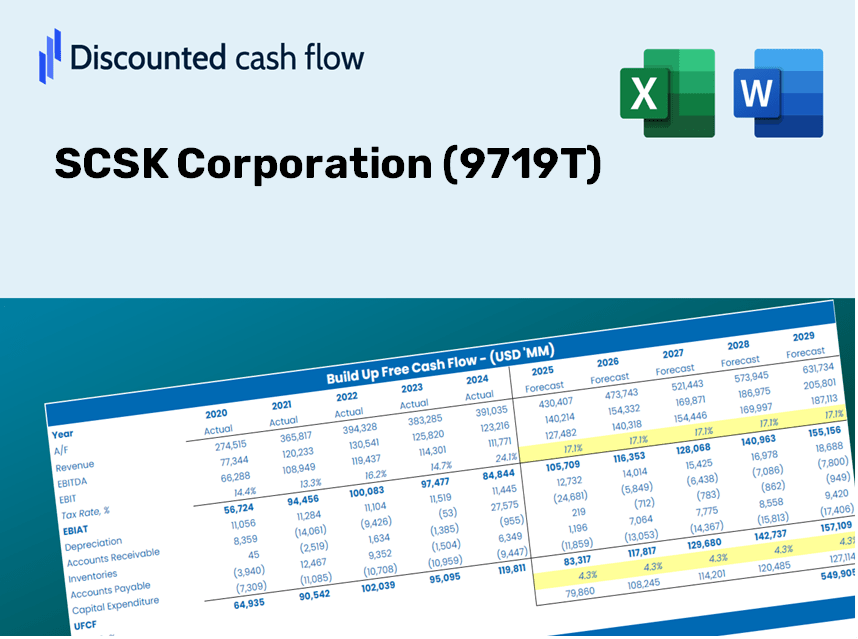
SCSK Corporation (9719.T) DCF Valuation |
Fully Editable: Tailor To Your Needs In Excel Or Sheets
Professional Design: Trusted, Industry-Standard Templates
Investor-Approved Valuation Models
MAC/PC Compatible, Fully Unlocked
No Expertise Is Needed; Easy To Follow
SCSK Corporation (9719.T) Bundle
Designed for accuracy, our (9719T) DCF Calculator enables you to assess SCSK Corporation's valuation using real-world financial data, offering complete flexibility to modify all key parameters for improved projections.
Exclusive Benefits
- Authentic SCSK Financial Data: Access comprehensive historical and projected figures for precise valuation.
- Customizable Parameters: Adjust WACC, tax rates, revenue growth, and capital expenditures to fit your analysis.
- Real-Time Calculations: Automatically computes intrinsic value and NPV for you.
- Scenario Testing: Explore various scenarios to assess SCSK’s potential future outcomes.
- User-Friendly Layout: Designed for both seasoned professionals and beginners alike.
Key Features
- Real-Life SCSK Data: Pre-filled with SCSK Corporation's historical financials and future projections.
- Fully Customizable Inputs: Modify revenue growth, margins, WACC, tax rates, and capital expenditures to suit your analysis.
- Dynamic Valuation Model: Automatic updates to Net Present Value (NPV) and intrinsic value based on your customized inputs.
- Scenario Testing: Generate multiple forecasting scenarios to evaluate various valuation outcomes.
- User-Friendly Design: Intuitive, well-structured, and accessible for both professionals and beginners.
Process Overview
- 1. Access the Template: Download and open the Excel file featuring SCSK Corporation’s (9719T) preloaded data.
- 2. Adjust Key Assumptions: Modify essential inputs such as growth rates, WACC, and capital expenditures.
- 3. Instantly Review Results: The DCF model automatically computes intrinsic value and NPV.
- 4. Explore Different Scenarios: Evaluate various forecasts to understand different valuation scenarios.
- 5. Present with Assurance: Deliver professional valuation insights to inform your strategic decisions.
Why Choose This Calculator for SCSK Corporation (9719T)?
- User-Friendly Interface: Perfect for both novice users and seasoned professionals.
- Customizable Inputs: Easily adjust parameters to tailor your analysis.
- Real-Time Valuation: Observe immediate changes in SCSK Corporation's valuation as you modify inputs.
- Pre-Loaded Financials: Comes equipped with SCSK Corporation's actual financial data for quick assessments.
- Widely Endorsed: Favored by investors and analysts for making informed investment choices.
Who Can Benefit from This Product?
- Investors: Evaluate SCSK Corporation’s (9719T) valuation prior to making investment decisions.
- CFOs and Financial Analysts: Enhance valuation workflows and assess financial forecasts.
- Startup Founders: Discover valuation practices of established public companies like SCSK Corporation (9719T).
- Consultants: Create detailed valuation reports for your clients.
- Students and Educators: Utilize real data to develop and teach valuation methodologies.
Contents of the Template
- Historical Data: Comprises SCSK Corporation’s past financial performance and baseline forecasts.
- DCF and Levered DCF Models: Comprehensive templates for assessing the intrinsic value of SCSK Corporation.
- WACC Sheet: Pre-configured calculations for the Weighted Average Cost of Capital.
- Editable Inputs: Adjust critical variables such as growth rates, EBITDA percentages, and CAPEX assumptions.
- Quarterly and Annual Statements: Detailed breakdown of SCSK Corporation’s financials.
- Interactive Dashboard: Dynamically visualize valuation outcomes and projections.
Disclaimer
All information, articles, and product details provided on this website are for general informational and educational purposes only. We do not claim any ownership over, nor do we intend to infringe upon, any trademarks, copyrights, logos, brand names, or other intellectual property mentioned or depicted on this site. Such intellectual property remains the property of its respective owners, and any references here are made solely for identification or informational purposes, without implying any affiliation, endorsement, or partnership.
We make no representations or warranties, express or implied, regarding the accuracy, completeness, or suitability of any content or products presented. Nothing on this website should be construed as legal, tax, investment, financial, medical, or other professional advice. In addition, no part of this site—including articles or product references—constitutes a solicitation, recommendation, endorsement, advertisement, or offer to buy or sell any securities, franchises, or other financial instruments, particularly in jurisdictions where such activity would be unlawful.
All content is of a general nature and may not address the specific circumstances of any individual or entity. It is not a substitute for professional advice or services. Any actions you take based on the information provided here are strictly at your own risk. You accept full responsibility for any decisions or outcomes arising from your use of this website and agree to release us from any liability in connection with your use of, or reliance upon, the content or products found herein.