
|
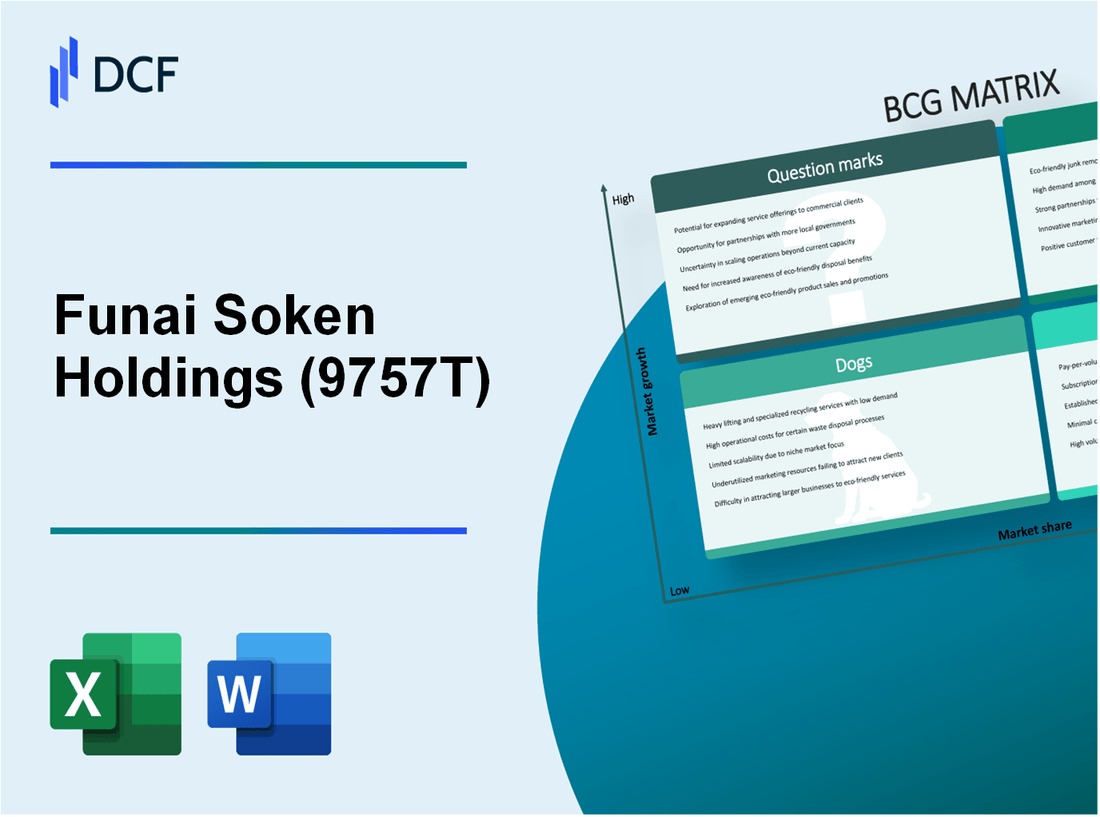
Funai Soken Holdings Incorporated (9757.T): BCG Matrix [Apr-2026 Updated] |
Fully Editable: Tailor To Your Needs In Excel Or Sheets
Professional Design: Trusted, Industry-Standard Templates
Investor-Approved Valuation Models
MAC/PC Compatible, Fully Unlocked
No Expertise Is Needed; Easy To Follow
Funai Soken Holdings Incorporated (9757.T) Bundle
Funai Soken's portfolio balances high-growth "stars"-digital transformation, HR Force recruiting and ESG consulting, which are driving strong margins and targeted capex-with robust cash cows like core monthly management and logistics services that fund expansion; meanwhile, promising but underweight bets in China, SME M&A and proprietary SaaS demand continued investment to scale, and low-return legacy real estate and publishing units look ripe for restructuring or divestment-a mix that makes the company's capital-allocation choices pivotal for translating today's investments into tomorrow's market leadership.
Funai Soken Holdings Incorporated (9757.T) - BCG Matrix Analysis: Stars
Stars
Digital Transformation Consulting for SMEs is a Star for Funai Soken, contributing 24% of group revenue for the fiscal year ending December 2025. The segment operates in a Japanese SME digital market growing at 16% CAGR, with Funai Soken capturing significant share via standardized digital implementation toolkits. Key financial and operational metrics for this business unit are detailed below.
| Metric | Value |
|---|---|
| Revenue Contribution (FY2025) | 24% of group revenue |
| Market Growth Rate | 16% annually |
| Operating Margin | 29% |
| CapEx Allocation | 1.8 billion JPY (proprietary AI diagnostic tools) |
| Return on Investment (ROI) | 22% |
| Primary Competitive Advantage | Standardized implementation toolkits & AI diagnostics |
Strategic implications and operational strengths for Digital Transformation include:
- High margin scalability: 29% operating margin driven by repeatable, standardized delivery models reducing per-client cost.
- High reinvestment intensity: 1.8 billion JPY CapEx signals commitment to sustain tech leadership in diagnostics and automation.
- Market conversion efficiency: 22% ROI demonstrates effective conversion of market growth into shareholder value.
- Cross-selling potential: existing SME client base provides upsell paths to managed services and recurring revenue.
HR Force Direct Recruiting Solutions is categorized as a Star due to its position in a recruitment tech sector expanding around 20% year-on-year and its strong performance within the SME direct recruiting niche. The subsidiary contributes 15% of total group revenue and holds a 12% market share in its specialized niche.
| Metric | Value |
|---|---|
| Revenue Contribution (FY2025) | 15% of group revenue |
| Sector Growth Rate | 20% YoY |
| Functional Market Share (niche) | 12% |
| Operating Margin | 25% |
| R&D Investment | 1.2 billion JPY (recruiting algorithms) |
| Client Retention | 88% corporate client retention rate |
Strategic implications and operational strengths for HR Force include:
- Scalable unit economics: cloud-native platform supports margin expansion as volume grows (25% operating margin).
- Technology moat: 1.2 billion JPY R&D investment in algorithms preserves differentiation versus legacy job boards.
- High client stickiness: 88% retention reduces churn-related acquisition costs and stabilizes recurring revenue.
- Market share momentum: 12% niche share in a 20% growth market positions the unit to convert growth into dominant market presence.
Sustainability and ESG Consulting Services has evolved into a Star as regulatory pressure in Japan drives SME demand; the segment now contributes 8% to group revenue while operating in a market expanding at approximately 22% annually. The division achieves elevated margins by leveraging cross-sell strategies to the existing client base.
| Metric | Value |
|---|---|
| Revenue Contribution (FY2025) | 8% of group revenue |
| Market Growth Rate | 22% annually |
| Operating Margin | 31% |
| Investment in Capability Building | 500 million JPY (training & certification) |
| Internal Rate of Return (IRR) | 19% |
| Primary Levers | Cross-selling environmental audits & advisory to existing SME clients |
Strategic implications and operational strengths for Sustainability and ESG Consulting include:
- Premium margins: 31% operating margin reflects high-value advisory and low-capital service model.
- First-mover advantage: 500 million JPY invested in certifications secures credibility as regulations tighten.
- High-growth alignment: 22% market growth delivers runway for rapid revenue scaling from an 8% base contribution.
- Attractive returns: 19% IRR indicates efficient capital deployment relative to growth prospects and low ongoing CapEx needs.
Funai Soken Holdings Incorporated (9757.T) - BCG Matrix Analysis: Cash Cows
Cash Cows
The Core Monthly Management Support Services is the principal cash-generating unit, accounting for 52% of consolidated revenue. Operating in a mature domestic SME advisory market with an annual growth rate of approximately 4%, the segment holds a dominant 35% market share among SME consulting firms in Japan. It consistently delivers an operating margin of 26% and a segment-specific return on assets (ROA) exceeding 15%, generating steady free cash flow that funds investments in higher-growth units and shareholder distributions.
Key financial and operational metrics for Core Monthly Management Support Services:
| Metric | Value |
|---|---|
| Revenue Contribution | 52% of consolidated revenue |
| Market Growth Rate | 4% per annum |
| Relative Market Share (domestic SME consulting) | 35% |
| Operating Margin | 26% |
| Return on Assets (ROA) | >15% |
| Annual Capital Expenditure | ~400 million JPY |
| Primary CapEx Use | Human capital, training, workflow tools |
| Cash Flow Role | Primary liquidity source for corporate investments |
Funai Soken Logistics Consulting contributes 10% of group revenue, operating in a stable logistics advisory market growing ~5% annually. The unit commands an 18% share of the specialized third-party logistics (3PL) advisory segment for mid-sized retailers. It posts an operating margin of 21% and a return on equity (ROE) of 17%, with minimal capex needs (approximately 200 million JPY annually) focused on software maintenance and industry-specific research rather than expansion.
Key financial and operational metrics for Funai Soken Logistics Consulting:
| Metric | Value |
|---|---|
| Revenue Contribution | 10% of consolidated revenue |
| Market Growth Rate | 5% per annum |
| Relative Market Share (3PL advisory for mid-sized retailers) | 18% |
| Operating Margin | 21% |
| Return on Equity (ROE) | 17% |
| Annual Capital Expenditure | ~200 million JPY |
| Primary CapEx Use | Routine software updates, analytics tools |
| Strategic Role | Steady cash contributor with low reinvestment needs |
Industry Specific Management Seminars and workshops generate roughly 7% of group revenue. Operating in a low-growth educational niche (~3% annual growth), the segment benefits from a 25% market share among SME executive education providers due to a strong alumni network and proprietary curricula. With content development costs amortized, the segment achieves a high operating margin of 30% and requires minimal annual capex (~150 million JPY) primarily for venues and digital broadcasting infrastructure. Cash flows from seminars support dividend policy and coverage of corporate fixed costs.
Key financial and operational metrics for Industry Specific Management Seminars:
| Metric | Value |
|---|---|
| Revenue Contribution | 7% of consolidated revenue |
| Market Growth Rate | 3% per annum |
| Relative Market Share (SME executive education) | 25% |
| Operating Margin | 30% |
| Annual Capital Expenditure | ~150 million JPY |
| Primary CapEx Use | Venues, AV equipment, digital broadcast platforms |
| Contribution to Payouts | Supports dividend payout ratio of 45% |
Collective characteristics of Cash Cows within Funai Soken:
- Combined revenue share: 69% of consolidated revenue (52% + 10% + 7%).
- Weighted average operating margin: approximately 25.5% (based on segment margins and revenue weights).
- Aggregate annual capex: ~750 million JPY (400 + 200 + 150 million JPY).
- Average market growth across segments: ~4% weighted by revenue contribution.
- Primary use of cash: fund Stars and Question Marks, maintain dividend policy, and cover corporate SG&A.
Funai Soken Holdings Incorporated (9757.T) - BCG Matrix Analysis: Question Marks
Question Marks - Dogs category analysis focuses on business units with low relative market share in high-growth markets. These segments require capital allocation decisions to either scale market share rapidly or divest. The following assessment details three primary question-mark businesses within Funai Soken Holdings: Global Business Expansion in China, SME-focused M&A Advisory, and Proprietary SaaS Management Platforms.
Global Business Expansion in China: This overseas consulting division targets the Chinese market, where the regional market growth rate is 18.0% annually. Current contribution to consolidated revenue is 3.0% with an estimated local market share below 1.0%. Cumulative investments to date total JPY 600 million covering local offices and talent acquisition. Operating margin is approximately 7.0%, suppressed by high initial setup and competitive pricing pressure. Client acquisition has increased at ~12.0% year-on-year; sustaining this rate is critical to move the unit toward break-even and meaningful scale.
| Metric | Value |
|---|---|
| Regional market growth rate | 18.0% p.a. |
| Revenue contribution (consolidated) | 3.0% |
| Estimated local market share | <1.0% |
| Capital invested (local infrastructure & hiring) | JPY 600,000,000 |
| Operating margin | 7.0% |
| Client acquisition growth | 12.0% YoY |
| Projected time to break-even (if 12% sustained) | Estimate: 3-5 years |
Key operational and strategic considerations for China:
- High top-line growth environment (18% p.a.) supports continued investment.
- Sub-1% market share indicates significant scaling potential but high competitive entry barriers.
- Short-term margin pressure (7%) due to fixed costs and price competition.
- Sustained client acquisition at 12% YoY is required to justify additional JPY capital deployment.
SME-Focused M&A Advisory: This unit addresses a domestic market expanding at 12.0% driven by succession and consolidation needs among aging Japanese SME owners. The segment contributes 5.0% of group revenue but holds a small market share of 2.0% within a highly fragmented advisory industry. Funai Soken has earmarked JPY 700 million to expand proprietary databases and deal-sourcing capabilities. Operating margin is volatile, averaging 14.0% but fluctuating substantially with deal closures. ROI to date is modest at 6.0%, reflecting long sales cycles and dependence on large-ticket transactions for outsized profitability.
| Metric | Value |
|---|---|
| Market growth rate | 12.0% p.a. |
| Revenue contribution (consolidated) | 5.0% |
| Market share (SME advisory) | 2.0% |
| Investment in dealflow & database | JPY 700,000,000 |
| Operating margin (average) | 14.0% (volatile) |
| Current ROI | 6.0% |
| Deal closure dependency | High - single large deals materially affect margin |
Strategic levers and risks for M&A advisory:
- Scale database to increase lead velocity and reduce dependency on sporadic large transactions.
- Improve conversion rates and reduce time-to-close to stabilize margin volatility.
- Potential to raise average fee per deal via cross-selling and packaged advisory services.
- Risk: continued low ROI if deal pipeline growth lags investment pace.
Proprietary SaaS Management Platforms: The SaaS initiative targets a high-growth market at 25.0% annually. Current revenue contribution is below 2.0% as the product is nascent and focused on user acquisition. Total capital expenditure committed over the past year equals JPY 1,500,000,000 for software development and cloud infrastructure. Operating margins are currently negative at -5.0% as the company prioritizes market share and trial-user growth over short-term profitability. Trial users are expanding rapidly at ~15.0% month-over-month; the principal challenge is converting trial users into long-term paid subscribers to achieve scalable unit economics.
| Metric | Value |
|---|---|
| Market growth rate | 25.0% p.a. |
| Revenue contribution (consolidated) | <2.0% |
| Capital expenditure (last 12 months) | JPY 1,500,000,000 |
| Operating margin | -5.0% |
| Trial-user growth | 15.0% monthly |
| Required KPI to shift to profit | Monthly conversion rate to paying subscribers ≥3-5% |
| Payback period target | 2-4 years post conversion scale-up |
Critical growth metrics and actions for SaaS:
- Convert 15% M/M trial growth into sustained paid conversion; target 3-5% monthly conversion to reach positive unit economics.
- Monitor customer acquisition cost (CAC) vs. lifetime value (LTV); reduce CAC via channel optimization.
- Leverage existing consulting client base to drive enterprise adoption and higher ARPU.
- Risk: continued negative margins if churn remains high or conversion stalls despite heavy capex.
Funai Soken Holdings Incorporated (9757.T) - BCG Matrix Analysis: Dogs
Question Marks - Dogs: This chapter examines low-growth, low-share legacy businesses within Funai Soken Holdings that align with the 'Dogs' quadrant of the BCG Matrix. The focus is on detailed financial and operational metrics for two legacy segments: Real Estate Brokerage Operations and Print Media & Publishing Services, highlighting stagnant markets, minimal market share, compressed margins, constrained capital expenditure, and low returns that justify active portfolio management decisions.
Legacy Real Estate Brokerage Operations: The general real estate brokerage division contributes only 3 percent to total corporate revenue and operates in a near‑stagnant market with 1 percent annual growth. Funai Soken's national market share in brokerage is below 0.5 percent in the highly fragmented and competitive Japanese real estate sector. Competitive price pressure from larger incumbents has driven the segment operating margin down to 8 percent. Capital expenditure is intentionally minimal at 50 million JPY annually as the company deprioritizes investment in this low-yield line. Return on investment (ROI) for the unit is approximately 4 percent, indicating underperformance versus corporate benchmarks and making it a candidate for restructuring, carve‑out, or divestment.
| Metric | Value |
|---|---|
| Revenue Contribution | 3% of Group Revenue |
| Market Growth Rate | +1% YoY |
| Relative Market Share | <0.5% (national) |
| Operating Margin | 8% |
| Annual Capital Expenditure | 50 million JPY |
| Return on Investment (ROI) | 4% |
| Headcount | Approx. 120 employees |
| Average Deal Size | ~8 million JPY |
| Customer Churn | ~18% annually |
Strategic considerations for the Real Estate Brokerage Operations include targeted cost rationalization, selective geographic exit, partnering with larger brokers, or disposal. The segment's weak economics and limited strategic fit push management toward options that minimize ongoing capital allocation and maximize recovery value.
- Pursue restructuring to reduce fixed costs and streamline branch network.
- Explore sale to a regional or national broker to realize asset value.
- Limit further capex and allocate marketing budget to retention rather than expansion.
- Retain a small center of excellence if strategic client overlap exists with advisory services.
Print Media and Publishing Services: The legacy publishing arm focused on business books and physical journals accounts for roughly 2 percent of group revenue. The addressable market is contracting at approximately -3 percent annually as digital substitution accelerates. Funai Soken's market share in business publishing stands at about 1 percent, reflecting a decline in relevance and distribution reach. Operating margin is low at 5 percent given fixed costs of printing and distribution, and there is zero allocated capital expenditure for new printing technology as management shifts focus and funding to digital content development. Return on assets (ROA) for the publishing segment is approximately 3 percent, substantially below corporate averages and insufficient to justify continued heavy resource allocation.
| Metric | Value |
|---|---|
| Revenue Contribution | 2% of Group Revenue |
| Market Growth Rate | -3% YoY |
| Relative Market Share | 1% in Business Publishing |
| Operating Margin | 5% |
| Annual Capital Expenditure | 0 JPY (no new printing capex) |
| Return on Assets (ROA) | 3% |
| Annual Titles Published | ~35 physical titles |
| Average Print Run | ~4,000 copies per title |
| Digital Revenue Share | ~18% of segment revenue |
Options for the Print Media and Publishing Services include accelerated digital migration for valuable IP, licensing or sale of backlist content, outsourcing print-on-demand, or full divestment. Given negative market dynamics and near-zero capex, decisions should prioritize freeing management bandwidth and redeploying proceeds to higher-growth digital initiatives.
- Monetize backlist via digital licensing and aggregator partnerships.
- Outsource printing to reduce fixed-cost base and convert to variable costs.
- Divest the legacy imprint to a niche publisher or media consolidator.
- Retain only high-margin content and migrate production to digital-first formats.
Disclaimer
All information, articles, and product details provided on this website are for general informational and educational purposes only. We do not claim any ownership over, nor do we intend to infringe upon, any trademarks, copyrights, logos, brand names, or other intellectual property mentioned or depicted on this site. Such intellectual property remains the property of its respective owners, and any references here are made solely for identification or informational purposes, without implying any affiliation, endorsement, or partnership.
We make no representations or warranties, express or implied, regarding the accuracy, completeness, or suitability of any content or products presented. Nothing on this website should be construed as legal, tax, investment, financial, medical, or other professional advice. In addition, no part of this site—including articles or product references—constitutes a solicitation, recommendation, endorsement, advertisement, or offer to buy or sell any securities, franchises, or other financial instruments, particularly in jurisdictions where such activity would be unlawful.
All content is of a general nature and may not address the specific circumstances of any individual or entity. It is not a substitute for professional advice or services. Any actions you take based on the information provided here are strictly at your own risk. You accept full responsibility for any decisions or outcomes arising from your use of this website and agree to release us from any liability in connection with your use of, or reliance upon, the content or products found herein.