
|
Trusco Nakayama Corporation (9830.T) DCF Valuation |
Fully Editable: Tailor To Your Needs In Excel Or Sheets
Professional Design: Trusted, Industry-Standard Templates
Investor-Approved Valuation Models
MAC/PC Compatible, Fully Unlocked
No Expertise Is Needed; Easy To Follow
Trusco Nakayama Corporation (9830.T) Bundle
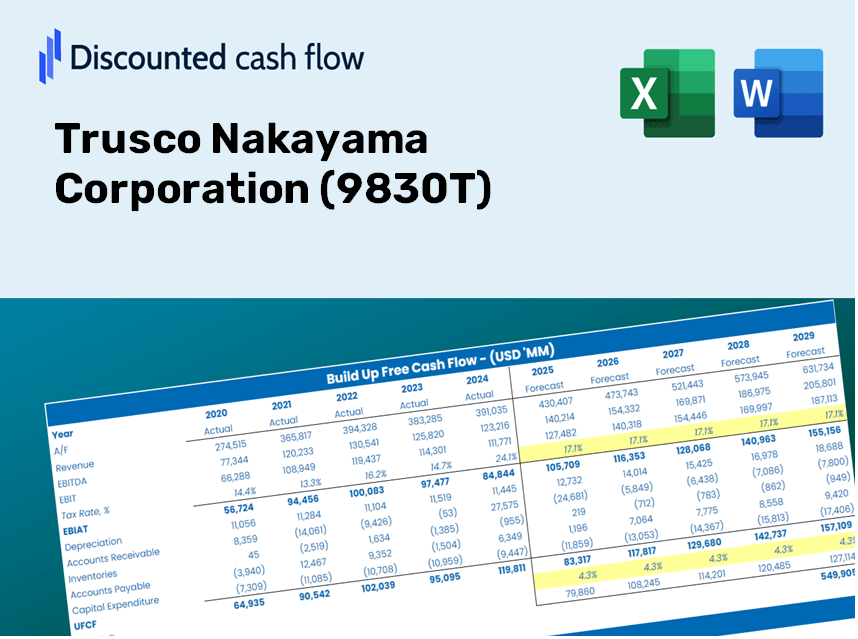
Gain insight into your Trusco Nakayama Corporation (9830T) valuation analysis using our sophisticated DCF Calculator! Preloaded with actual (9830T) data, this Excel template enables you to adjust forecasts and assumptions, allowing you to calculate the intrinsic value of Trusco Nakayama Corporation with accuracy.
Discounted Cash Flow (DCF) - (USD MM)
| Year | AY1 2020 |
AY2 2021 |
AY3 2022 |
AY4 2023 |
AY5 2024 |
FY1 2025 |
FY2 2026 |
FY3 2027 |
FY4 2028 |
FY5 2029 |
|---|---|---|---|---|---|---|---|---|---|---|
| Revenue | 213,404.0 | 226,833.0 | 246,453.0 | 268,154.0 | 295,024.0 | 319,929.9 | 346,938.4 | 376,226.9 | 407,988.0 | 442,430.3 |
| Revenue Growth, % | 0 | 6.29 | 8.65 | 8.81 | 10.02 | 8.44 | 8.44 | 8.44 | 8.44 | 8.44 |
| EBITDA | 18,232.0 | 24,016.0 | 22,038.0 | 24,237.0 | 26,066.0 | 29,399.4 | 31,881.3 | 34,572.8 | 37,491.4 | 40,656.4 |
| EBITDA, % | 8.54 | 10.59 | 8.94 | 9.04 | 8.84 | 9.19 | 9.19 | 9.19 | 9.19 | 9.19 |
| Depreciation | 6,588.0 | 6,957.0 | 6,690.0 | 6,229.0 | 6,087.0 | 8,481.2 | 9,197.2 | 9,973.6 | 10,815.6 | 11,728.6 |
| Depreciation, % | 3.09 | 3.07 | 2.71 | 2.32 | 2.06 | 2.65 | 2.65 | 2.65 | 2.65 | 2.65 |
| EBIT | 11,644.0 | 17,059.0 | 15,348.0 | 18,008.0 | 19,979.0 | 20,918.2 | 22,684.2 | 24,599.2 | 26,675.8 | 28,927.8 |
| EBIT, % | 5.46 | 7.52 | 6.23 | 6.72 | 6.77 | 6.54 | 6.54 | 6.54 | 6.54 | 6.54 |
| Total Cash | 32,383.0 | 41,469.0 | 39,400.0 | 43,283.0 | 41,352.0 | 50,933.3 | 55,233.0 | 59,895.8 | 64,952.2 | 70,435.5 |
| Total Cash, percent | .0 | .0 | .0 | .0 | .0 | .0 | .0 | .0 | .0 | .0 |
| Account Receivables | 27,554.0 | 31,093.0 | 34,314.0 | 37,142.0 | 40,355.0 | 43,556.4 | 47,233.4 | 51,220.9 | 55,544.9 | 60,234.0 |
| Account Receivables, % | 12.91 | 13.71 | 13.92 | 13.85 | 13.68 | 13.61 | 13.61 | 13.61 | 13.61 | 13.61 |
| Inventories | 41,542.0 | 42,627.0 | 45,292.0 | 50,848.0 | 55,366.0 | 60,380.4 | 65,477.7 | 71,005.3 | 76,999.6 | 83,499.9 |
| Inventories, % | 19.47 | 18.79 | 18.38 | 18.96 | 18.77 | 18.87 | 18.87 | 18.87 | 18.87 | 18.87 |
| Accounts Payable | 15,616.0 | 16,354.0 | 18,866.0 | 20,461.0 | 22,121.0 | 23,873.6 | 25,889.0 | 28,074.5 | 30,444.6 | 33,014.7 |
| Accounts Payable, % | 7.32 | 7.21 | 7.66 | 7.63 | 7.5 | 7.46 | 7.46 | 7.46 | 7.46 | 7.46 |
| Capital Expenditure | -8,869.0 | -8,595.0 | -4,932.0 | -13,115.0 | -19,287.0 | -13,676.7 | -14,831.3 | -16,083.4 | -17,441.1 | -18,913.5 |
| Capital Expenditure, % | -4.16 | -3.79 | -2 | -4.89 | -6.54 | -4.27 | -4.27 | -4.27 | -4.27 | -4.27 |
| Tax Rate, % | 28.94 | 28.94 | 28.94 | 28.94 | 28.94 | 28.94 | 28.94 | 28.94 | 28.94 | 28.94 |
| EBITAT | 8,065.9 | 11,644.5 | 10,688.0 | 12,336.5 | 14,196.4 | 14,506.0 | 15,730.6 | 17,058.6 | 18,498.6 | 20,060.3 |
| Depreciation | ||||||||||
| Changes in Account Receivables | ||||||||||
| Changes in Inventories | ||||||||||
| Changes in Accounts Payable | ||||||||||
| Capital Expenditure | ||||||||||
| UFCF | -47,695.1 | 6,120.5 | 9,072.0 | -1,338.5 | -5,074.6 | 2,847.3 | 3,337.5 | 3,619.3 | 3,924.8 | 4,256.1 |
| WACC, % | 4.54 | 4.53 | 4.54 | 4.53 | 4.56 | 4.54 | 4.54 | 4.54 | 4.54 | 4.54 |
| PV UFCF | ||||||||||
| SUM PV UFCF | 15,639.5 | |||||||||
| Long Term Growth Rate, % | 3.00 | |||||||||
| Free cash flow (T + 1) | 4,384 | |||||||||
| Terminal Value | 284,320 | |||||||||
| Present Terminal Value | 227,696 | |||||||||
| Enterprise Value | 243,336 | |||||||||
| Net Debt | 15,148 | |||||||||
| Equity Value | 228,188 | |||||||||
| Diluted Shares Outstanding, MM | 66 | |||||||||
| Equity Value Per Share | 3,460.49 |
Benefits You Will Receive
- Accurate (9830T) Financial Data: Instantly access Trusco Nakayama's historical and projected financial figures for detailed analysis.
- Customizable Template: Easily adjust essential inputs such as revenue growth, WACC, and EBITDA percentage to fit your analysis needs.
- Instant Calculations: Watch as Trusco Nakayama’s intrinsic value recalibrates immediately based on your adjustments.
- Advanced Valuation Tool: Tailored for investors, analysts, and consultants aiming for reliable DCF evaluations.
- Intuitive Design: An easy-to-navigate layout and clear guidance suitable for all skill levels.
Key Features
- Real-Life (9830T) Data: Pre-filled with Trusco Nakayama Corporation's historical financials and future projections.
- Fully Customizable Inputs: Modify revenue growth rates, profit margins, WACC, tax rates, and capital expenditures as needed.
- Dynamic Valuation Model: Automatically updates Net Present Value (NPV) and intrinsic value based on your customized inputs.
- Scenario Testing: Develop multiple forecasting scenarios to evaluate various valuation outcomes.
- User-Friendly Design: Intuitive, organized, and tailored for both professionals and newcomers.
How It Works
- Step 1: Download the Excel file.
- Step 2: Review Trusco Nakayama Corporation's pre-filled financial data and forecasts.
- Step 3: Adjust key inputs such as revenue growth, WACC, and tax rates (highlighted cells).
- Step 4: Observe the DCF model update in real-time as you modify your assumptions.
- Step 5: Analyze the results and leverage them for your investment decisions regarding Trusco Nakayama Corporation (9830T).
Why Choose This Calculator for Trusco Nakayama Corporation (9830T)?
- Reliable Data: Utilize authentic Trusco Nakayama financials for trustworthy valuation outcomes.
- Tailorable: Modify essential variables such as growth rates, WACC, and tax rates to align with your forecasts.
- Efficient: Integrated calculations save time by eliminating the need to build from the ground up.
- Expert-Level Tool: Crafted for investors, analysts, and consultants in the field.
- Easy to Use: User-friendly design and guided instructions ensure accessibility for all users.
Who Can Benefit from This Product?
- Investors: Effectively determine Trusco Nakayama Corporation’s (9830T) fair value prior to making investment choices.
- CFOs: Utilize a professional-grade DCF model for accurate financial reporting and analysis.
- Consultants: Easily customize the template for valuation reports tailored to clients' needs.
- Entrepreneurs: Gain valuable insights into the financial modeling practices of established firms.
- Educators: Employ it as a teaching resource to illustrate various valuation techniques.
Contents of the Template
- Preloaded Trusco Nakayama Data: Historical and forecasted financial information, including revenue, EBIT, and capital expenditures.
- DCF and WACC Models: Advanced spreadsheets for calculating intrinsic value and Weighted Average Cost of Capital.
- Customizable Inputs: Yellow-highlighted cells for modifying revenue growth, tax rates, and discount rates.
- Financial Statements: Detailed annual and quarterly financials for comprehensive analysis.
- Key Ratios: Metrics for profitability, leverage, and efficiency to assess performance.
- Dashboard and Charts: Visual representations of valuation results and assumptions.
Disclaimer
All information, articles, and product details provided on this website are for general informational and educational purposes only. We do not claim any ownership over, nor do we intend to infringe upon, any trademarks, copyrights, logos, brand names, or other intellectual property mentioned or depicted on this site. Such intellectual property remains the property of its respective owners, and any references here are made solely for identification or informational purposes, without implying any affiliation, endorsement, or partnership.
We make no representations or warranties, express or implied, regarding the accuracy, completeness, or suitability of any content or products presented. Nothing on this website should be construed as legal, tax, investment, financial, medical, or other professional advice. In addition, no part of this site—including articles or product references—constitutes a solicitation, recommendation, endorsement, advertisement, or offer to buy or sell any securities, franchises, or other financial instruments, particularly in jurisdictions where such activity would be unlawful.
All content is of a general nature and may not address the specific circumstances of any individual or entity. It is not a substitute for professional advice or services. Any actions you take based on the information provided here are strictly at your own risk. You accept full responsibility for any decisions or outcomes arising from your use of this website and agree to release us from any liability in connection with your use of, or reliance upon, the content or products found herein.