
|
Yamada Holdings Co., Ltd. (9831.T) DCF Valuation |
Fully Editable: Tailor To Your Needs In Excel Or Sheets
Professional Design: Trusted, Industry-Standard Templates
Investor-Approved Valuation Models
MAC/PC Compatible, Fully Unlocked
No Expertise Is Needed; Easy To Follow
Yamada Holdings Co., Ltd. (9831.T) Bundle
Save time and improve precision with our (9831T) DCF Calculator! Utilizing actual Yamada Holdings Co., Ltd. data and customizable assumptions, this tool empowers you to forecast, analyze, and value Yamada Holdings like a professional investor.
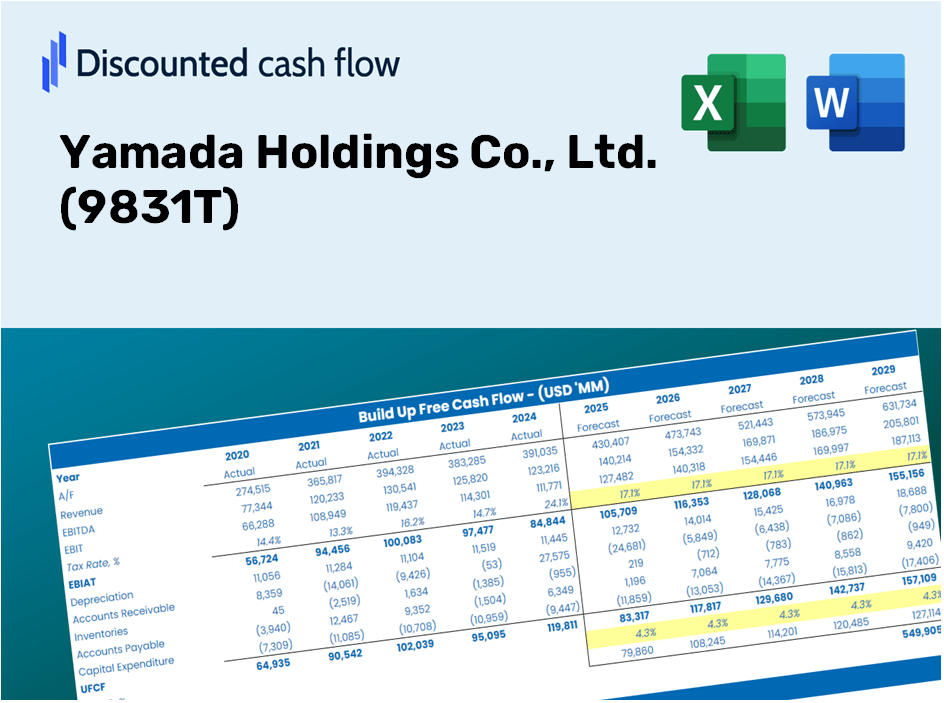
Discounted Cash Flow (DCF) - (USD MM)
| Year | AY1 2021 |
AY2 2022 |
AY3 2023 |
AY4 2024 |
AY5 2025 |
FY1 2026 |
FY2 2027 |
FY3 2028 |
FY4 2029 |
FY5 2030 |
|---|---|---|---|---|---|---|---|---|---|---|
| Revenue | 1,752,506.0 | 1,619,379.0 | 1,600,586.0 | 1,592,009.0 | 1,629,069.0 | 1,582,098.9 | 1,536,483.1 | 1,492,182.5 | 1,449,159.2 | 1,407,376.4 |
| Revenue Growth, % | 0 | -7.6 | -1.16 | -0.53587 | 2.33 | -2.88 | -2.88 | -2.88 | -2.88 | -2.88 |
| EBITDA | 100,726.0 | 95,380.0 | 70,181.0 | 67,097.0 | 72,170.0 | 78,051.0 | 75,800.6 | 73,615.1 | 71,492.6 | 69,431.3 |
| EBITDA, % | 5.75 | 5.89 | 4.38 | 4.21 | 4.43 | 4.93 | 4.93 | 4.93 | 4.93 | 4.93 |
| Depreciation | 21,853.0 | 24,428.0 | 25,125.0 | 26,143.0 | 27,014.0 | 24,128.8 | 23,433.1 | 22,757.5 | 22,101.3 | 21,464.1 |
| Depreciation, % | 1.25 | 1.51 | 1.57 | 1.64 | 1.66 | 1.53 | 1.53 | 1.53 | 1.53 | 1.53 |
| EBIT | 78,873.0 | 70,952.0 | 45,056.0 | 40,954.0 | 45,156.0 | 53,922.2 | 52,367.5 | 50,857.6 | 49,391.3 | 47,967.2 |
| EBIT, % | 4.5 | 4.38 | 2.81 | 2.57 | 2.77 | 3.41 | 3.41 | 3.41 | 3.41 | 3.41 |
| Total Cash | 74,438.0 | 57,184.0 | 47,236.0 | 55,236.0 | 68,375.0 | 58,210.7 | 56,532.4 | 54,902.4 | 53,319.4 | 51,782.1 |
| Total Cash, percent | .0 | .0 | .0 | .0 | .0 | .0 | .0 | .0 | .0 | .0 |
| Account Receivables | 77,238.0 | 80,478.0 | 89,346.0 | 105,916.0 | 116,512.0 | 91,015.3 | 88,391.1 | 85,842.5 | 83,367.5 | 80,963.8 |
| Account Receivables, % | 4.41 | 4.97 | 5.58 | 6.65 | 7.15 | 5.75 | 5.75 | 5.75 | 5.75 | 5.75 |
| Inventories | 403,027.0 | 396,616.0 | 394,921.0 | 419,177.0 | 407,265.0 | 390,754.7 | 379,488.3 | 368,546.7 | 357,920.6 | 347,600.8 |
| Inventories, % | 23 | 24.49 | 24.67 | 26.33 | 25 | 24.7 | 24.7 | 24.7 | 24.7 | 24.7 |
| Accounts Payable | 120,647.0 | 109,601.0 | 104,788.0 | 113,285.0 | 99,200.0 | 105,698.2 | 102,650.6 | 99,691.0 | 96,816.6 | 94,025.2 |
| Accounts Payable, % | 6.88 | 6.77 | 6.55 | 7.12 | 6.09 | 6.68 | 6.68 | 6.68 | 6.68 | 6.68 |
| Capital Expenditure | -23,291.0 | -29,553.0 | -21,535.0 | -26,342.0 | -41,245.0 | -27,483.8 | -26,691.4 | -25,921.8 | -25,174.4 | -24,448.6 |
| Capital Expenditure, % | -1.33 | -1.82 | -1.35 | -1.65 | -2.53 | -1.74 | -1.74 | -1.74 | -1.74 | -1.74 |
| Tax Rate, % | 37.22 | 37.22 | 37.22 | 37.22 | 37.22 | 37.22 | 37.22 | 37.22 | 37.22 | 37.22 |
| EBITAT | 52,706.8 | 51,588.2 | 32,898.8 | 25,109.6 | 28,349.0 | 36,305.1 | 35,258.3 | 34,241.7 | 33,254.4 | 32,295.6 |
| Depreciation | ||||||||||
| Changes in Account Receivables | ||||||||||
| Changes in Inventories | ||||||||||
| Changes in Accounts Payable | ||||||||||
| Capital Expenditure | ||||||||||
| UFCF | -308,349.2 | 38,588.2 | 24,502.8 | -7,418.4 | 1,349.0 | 81,455.3 | 42,843.1 | 41,607.8 | 40,408.2 | 39,243.1 |
| WACC, % | 3.59 | 3.7 | 3.7 | 3.48 | 3.51 | 3.6 | 3.6 | 3.6 | 3.6 | 3.6 |
| PV UFCF | ||||||||||
| SUM PV UFCF | 223,941.8 | |||||||||
| Long Term Growth Rate, % | 2.00 | |||||||||
| Free cash flow (T + 1) | 40,028 | |||||||||
| Terminal Value | 2,507,482 | |||||||||
| Present Terminal Value | 2,101,434 | |||||||||
| Enterprise Value | 2,325,376 | |||||||||
| Net Debt | 267,173 | |||||||||
| Equity Value | 2,058,203 | |||||||||
| Diluted Shares Outstanding, MM | 697 | |||||||||
| Equity Value Per Share | 2,952.09 |
Benefits of Using Our Model
- Flexible Forecast Inputs: Modify key assumptions (growth %, profit margins, WACC) to explore various scenarios.
- Comprehensive Data: Yamada Holdings Co., Ltd.’s (9831T) financial information pre-loaded to facilitate your analysis.
- Instant DCF Calculations: The template automatically computes Net Present Value (NPV) and intrinsic value.
- Professional and Adaptable: A refined Excel model tailored to meet your valuation requirements.
- Designed for Analysts and Investors: Perfect for evaluating forecasts, confirming strategies, and enhancing efficiency.
Key Features
- Customizable Forecast Inputs: Adjust essential metrics such as revenue growth, EBITDA margin, and capital expenditures.
- Instant DCF Valuation: Quickly computes intrinsic value, NPV, and additional financial outputs.
- High-Precision Results: Leverages Yamada Holdings Co., Ltd.'s real financial data for accurate valuation estimates.
- Effortless Scenario Analysis: Evaluate various scenarios and easily compare the results.
- Efficiency Boost: Removes the necessity of constructing intricate valuation models from the ground up.
How It Works
- Step 1: Download the Excel file for Yamada Holdings Co., Ltd. (9831T).
- Step 2: Review the pre-filled financial data and projections for Yamada Holdings.
- Step 3: Adjust key inputs such as revenue growth, WACC, and tax rates (highlighted cells).
- Step 4: Observe the real-time updates to the DCF model as you modify your assumptions.
- Step 5: Examine the results and leverage the outputs for your investment strategy.
Why Select This Calculator for Yamada Holdings Co., Ltd. (9831T)?
- Designed for Experts: A sophisticated tool favored by analysts, CFOs, and consultants working with Yamada Holdings.
- Accurate Financial Data: Historical and projected financial information for Yamada Holdings preloaded for reliable analysis.
- Flexible Scenario Analysis: Effortlessly test various forecasts and assumptions tailored for Yamada Holdings.
- Intuitive Outputs: Instantly calculates intrinsic value, NPV, and essential performance indicators.
- User-Friendly: Comprehensive step-by-step instructions ensure a smooth user experience.
Who Can Benefit from Yamada Holdings Co., Ltd. (9831T)?
- Finance Students: Discover valuation methodologies and apply them to real market data.
- Academics: Integrate established financial models into your research or teaching materials.
- Investors: Validate your investment strategies and evaluate valuation results for Yamada Holdings Co., Ltd. (9831T).
- Analysts: Enhance your efficiency with a ready-made, customizable DCF model tailored for Yamada Holdings Co., Ltd. (9831T).
- Small Business Owners: Understand the analytical approaches used for large publicly traded companies like Yamada Holdings Co., Ltd. (9831T).
Contents of the Template
- Operating and Balance Sheet Data: Pre-filled historical data and forecasts for Yamada Holdings Co., Ltd. (9831T), including revenue, EBITDA, EBIT, and capital expenditures.
- WACC Calculation: A dedicated sheet for the Weighted Average Cost of Capital (WACC), encompassing parameters such as Beta, risk-free rate, and share price.
- DCF Valuation (Unlevered and Levered): Customizable Discounted Cash Flow models that present intrinsic value with comprehensive calculations.
- Financial Statements: Pre-loaded financial statements (annual and quarterly) to enhance analysis.
- Key Ratios: Includes profitability, leverage, and efficiency ratios specific to Yamada Holdings Co., Ltd. (9831T).
- Dashboard and Charts: Visual representation of valuation outputs and assumptions for easier result analysis.
Disclaimer
All information, articles, and product details provided on this website are for general informational and educational purposes only. We do not claim any ownership over, nor do we intend to infringe upon, any trademarks, copyrights, logos, brand names, or other intellectual property mentioned or depicted on this site. Such intellectual property remains the property of its respective owners, and any references here are made solely for identification or informational purposes, without implying any affiliation, endorsement, or partnership.
We make no representations or warranties, express or implied, regarding the accuracy, completeness, or suitability of any content or products presented. Nothing on this website should be construed as legal, tax, investment, financial, medical, or other professional advice. In addition, no part of this site—including articles or product references—constitutes a solicitation, recommendation, endorsement, advertisement, or offer to buy or sell any securities, franchises, or other financial instruments, particularly in jurisdictions where such activity would be unlawful.
All content is of a general nature and may not address the specific circumstances of any individual or entity. It is not a substitute for professional advice or services. Any actions you take based on the information provided here are strictly at your own risk. You accept full responsibility for any decisions or outcomes arising from your use of this website and agree to release us from any liability in connection with your use of, or reliance upon, the content or products found herein.