
|
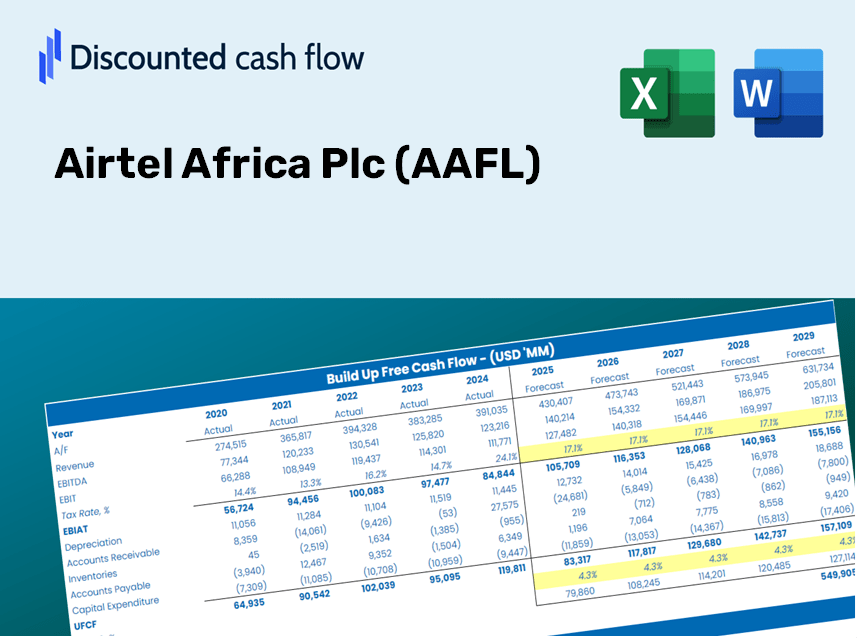
Airtel Africa Plc (AAF.L) DCF Valuation |
Fully Editable: Tailor To Your Needs In Excel Or Sheets
Professional Design: Trusted, Industry-Standard Templates
Investor-Approved Valuation Models
MAC/PC Compatible, Fully Unlocked
No Expertise Is Needed; Easy To Follow
Airtel Africa Plc (AAF.L) Bundle
Gain insight into your Airtel Africa Plc (AAFL) valuation analysis using our cutting-edge DCF Calculator! This Excel template comes preloaded with real data for (AAFL), enabling you to adjust forecasts and assumptions to accurately determine the intrinsic value of Airtel Africa Plc.
What You Will Receive
- Editable Forecast Inputs: Effortlessly modify key assumptions (growth %, margins, WACC) to explore various scenarios.
- Real-World Data: Airtel Africa Plc’s (AAFL) financial data included to enhance your analysis.
- Automatic DCF Outputs: The template computes Net Present Value (NPV) and intrinsic value automatically.
- Customizable and Professional: A refined Excel model designed to meet your valuation requirements.
- Built for Analysts and Investors: Perfect for evaluating projections, confirming strategies, and optimizing your time.
Key Features
- Comprehensive DCF Calculator: Features both unlevered and levered DCF valuation models tailored for Airtel Africa Plc (AAFL).
- Customizable WACC Calculator: Ready-to-use Weighted Average Cost of Capital sheet with adjustable parameters.
- Flexible Forecast Assumptions: Easily change growth rates, capital expenditures, and discount rates.
- Integrated Financial Ratios: Assess profitability, leverage, and efficiency ratios specific to Airtel Africa Plc (AAFL).
- User-Friendly Dashboard and Charts: Visual representations that condense essential valuation metrics for straightforward analysis.
How It Works
- Step 1: Download the prebuilt Excel template featuring Airtel Africa Plc’s (AAFL) data.
- Step 2: Review the pre-filled sheets to familiarize yourself with the key metrics.
- Step 3: Update the forecasts and assumptions in the editable yellow cells (WACC, growth, margins).
- Step 4: Instantly view the recalculated results, including Airtel Africa Plc’s (AAFL) intrinsic value.
- Step 5: Use the outputs to make informed investment decisions or create reports.
Why Choose This Calculator for Airtel Africa Plc (AAFL)?
- Precision: Accurate financial data from Airtel Africa ensures reliable results.
- Versatility: Tailored for users to easily adjust and experiment with various inputs.
- Efficiency: Eliminate the complexities of creating a DCF model from the ground up.
- Top-Tier Quality: Crafted with the precision and practicality expected by CFOs.
- Intuitive Design: Simple to navigate, suitable for users with all levels of financial expertise.
Who Can Benefit from This Product?
- Professional Investors: Create comprehensive and precise valuation models for analyzing your portfolio centered around Airtel Africa Plc (AAFL).
- Corporate Finance Teams: Evaluate various valuation scenarios to inform strategic decisions within your organization.
- Consultants and Advisors: Deliver clients accurate valuation insights for Airtel Africa Plc (AAFL) stock.
- Students and Educators: Leverage real market data to enhance financial modeling practice and education.
- Tech Enthusiasts: Gain insights into how telecommunications companies like Airtel Africa Plc (AAFL) are assessed in the financial landscape.
Contents of the Template
- Pre-Filled DCF Model: Airtel Africa Plc’s (AAFL) financial data integrated for immediate analysis.
- WACC Calculator: Comprehensive calculations for the Weighted Average Cost of Capital.
- Financial Ratios: Assess Airtel Africa’s (AAFL) profitability, leverage, and operational efficiency.
- Editable Inputs: Modify assumptions such as growth rates, margins, and CAPEX to suit your specific scenarios.
- Financial Statements: Annual and quarterly financial reports to facilitate thorough analysis.
- Interactive Dashboard: Effortlessly visualize essential valuation metrics and outcomes.
Disclaimer
All information, articles, and product details provided on this website are for general informational and educational purposes only. We do not claim any ownership over, nor do we intend to infringe upon, any trademarks, copyrights, logos, brand names, or other intellectual property mentioned or depicted on this site. Such intellectual property remains the property of its respective owners, and any references here are made solely for identification or informational purposes, without implying any affiliation, endorsement, or partnership.
We make no representations or warranties, express or implied, regarding the accuracy, completeness, or suitability of any content or products presented. Nothing on this website should be construed as legal, tax, investment, financial, medical, or other professional advice. In addition, no part of this site—including articles or product references—constitutes a solicitation, recommendation, endorsement, advertisement, or offer to buy or sell any securities, franchises, or other financial instruments, particularly in jurisdictions where such activity would be unlawful.
All content is of a general nature and may not address the specific circumstances of any individual or entity. It is not a substitute for professional advice or services. Any actions you take based on the information provided here are strictly at your own risk. You accept full responsibility for any decisions or outcomes arising from your use of this website and agree to release us from any liability in connection with your use of, or reliance upon, the content or products found herein.