
|
Arbor Realty Trust, Inc. (ABR) DCF Valuation |
Fully Editable: Tailor To Your Needs In Excel Or Sheets
Professional Design: Trusted, Industry-Standard Templates
Investor-Approved Valuation Models
MAC/PC Compatible, Fully Unlocked
No Expertise Is Needed; Easy To Follow
Arbor Realty Trust, Inc. (ABR) Bundle
Discover the true potential of Arbor Realty Trust, Inc. (ABR) with our advanced DCF Calculator! Adjust key assumptions, explore various scenarios, and evaluate how different factors influence Arbor Realty Trust, Inc. (ABR) valuation – all within a user-friendly Excel template.
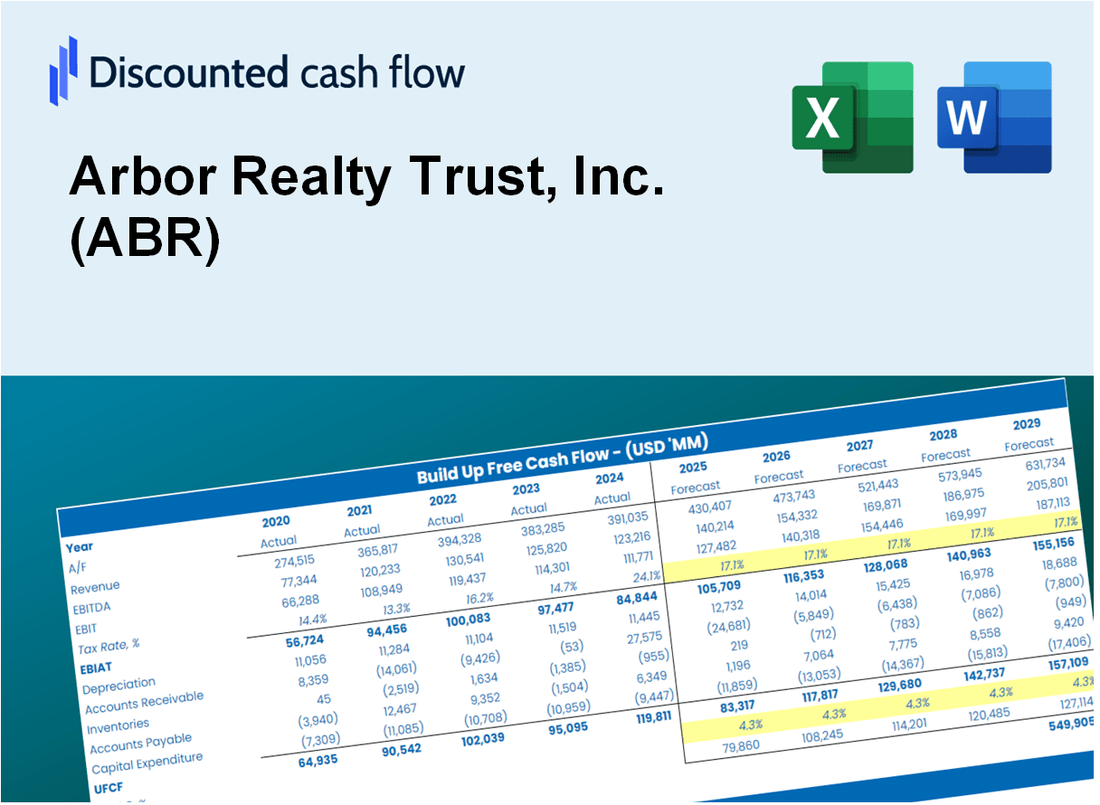
Discounted Cash Flow (DCF) - (USD MM)
| Year | AY1 2020 |
AY2 2021 |
AY3 2022 |
AY4 2023 |
AY5 2024 |
FY1 2025 |
FY2 2026 |
FY3 2027 |
FY4 2028 |
FY5 2029 |
|---|---|---|---|---|---|---|---|---|---|---|
| Revenue | 439.4 | 661.5 | 654.1 | 719.0 | 627.5 | 700.7 | 782.4 | 873.6 | 975.4 | 1,089.1 |
| Revenue Growth, % | 0 | 50.55 | -1.12 | 9.93 | -12.72 | 11.66 | 11.66 | 11.66 | 11.66 | 11.66 |
| EBITDA | 462.6 | 701.9 | 997.5 | 1,404.0 | 1,180.0 | 700.7 | 782.4 | 873.6 | 975.4 | 1,089.1 |
| EBITDA, % | 105.29 | 106.11 | 152.51 | 195.26 | 188.04 | 100 | 100 | 100 | 100 | 100 |
| Depreciation | 56.9 | 65.8 | 68.6 | 72.8 | 78.0 | 78.4 | 87.5 | 97.7 | 109.1 | 121.9 |
| Depreciation, % | 12.94 | 9.95 | 10.49 | 10.13 | 12.43 | 11.19 | 11.19 | 11.19 | 11.19 | 11.19 |
| EBIT | 405.8 | 636.1 | 928.9 | 1,331.1 | 1,102.0 | 684.6 | 764.4 | 853.5 | 953.0 | 1,064.1 |
| EBIT, % | 92.35 | 96.16 | 142.02 | 185.13 | 175.61 | 97.7 | 97.7 | 97.7 | 97.7 | 97.7 |
| Total Cash | 339.5 | 404.6 | 14.8 | 935.5 | 503.8 | 449.8 | 502.3 | 560.8 | 626.2 | 699.2 |
| Total Cash, percent | .0 | .0 | .0 | .0 | .0 | .0 | .0 | .0 | .0 | .0 |
| Account Receivables | 12.4 | 84.3 | 77.4 | 64.4 | 12.8 | 53.8 | 60.1 | 67.1 | 74.9 | 83.7 |
| Account Receivables, % | 2.83 | 12.75 | 11.84 | 8.96 | 2.04 | 7.68 | 7.68 | 7.68 | 7.68 | 7.68 |
| Inventories | .0 | -1.7 | -1.5 | .0 | .0 | -.7 | -.8 | -.8 | -.9 | -1.0 |
| Inventories, % | 0 | -0.25171 | -0.2301 | 0 | 0 | -0.09636108 | -0.09636108 | -0.09636108 | -0.09636108 | -0.09636108 |
| Accounts Payable | .0 | .0 | .0 | .0 | .0 | .0 | .0 | .0 | .0 | .0 |
| Accounts Payable, % | 0 | 0 | 0 | 0 | 0 | 0 | 0 | 0 | 0 | 0 |
| Capital Expenditure | .0 | .0 | .0 | .0 | .0 | .0 | .0 | .0 | .0 | .0 |
| Capital Expenditure, % | 0 | 0 | 0 | 0 | 0 | 0 | 0 | 0 | 0 | 0 |
| Tax Rate, % | 11.01 | 11.01 | 11.01 | 11.01 | 11.01 | 11.01 | 11.01 | 11.01 | 11.01 | 11.01 |
| EBITAT | 293.2 | 508.9 | 815.0 | 1,155.5 | 980.6 | 569.3 | 635.7 | 709.8 | 792.5 | 884.9 |
| Depreciation | ||||||||||
| Changes in Account Receivables | ||||||||||
| Changes in Inventories | ||||||||||
| Changes in Accounts Payable | ||||||||||
| Capital Expenditure | ||||||||||
| UFCF | 337.7 | 504.5 | 890.4 | 1,239.8 | 1,110.2 | 607.3 | 717.0 | 800.6 | 893.9 | 998.1 |
| WACC, % | 6.43 | 6.96 | 7.48 | 7.42 | 7.57 | 7.17 | 7.17 | 7.17 | 7.17 | 7.17 |
| PV UFCF | ||||||||||
| SUM PV UFCF | 3,225.0 | |||||||||
| Long Term Growth Rate, % | 2.00 | |||||||||
| Free cash flow (T + 1) | 1,018 | |||||||||
| Terminal Value | 19,692 | |||||||||
| Present Terminal Value | 13,929 | |||||||||
| Enterprise Value | 17,154 | |||||||||
| Net Debt | 6,657 | |||||||||
| Equity Value | 10,496 | |||||||||
| Diluted Shares Outstanding, MM | 206 | |||||||||
| Equity Value Per Share | 51.07 |
What You Will Get
- Real ABR Financials: Access to historical and projected data for precise valuation.
- Customizable Inputs: Adjust WACC, tax rates, revenue growth, and capital expenditures as needed.
- Automated Calculations: Intrinsic value and NPV are computed in real-time.
- Scenario Analysis: Evaluate various scenarios to assess Arbor Realty Trust's future performance.
- User-Friendly Design: Designed for professionals but easy for newcomers to navigate.
Key Features
- Customizable Investment Metrics: Adjust essential parameters such as interest rates, loan-to-value ratios, and property appreciation rates.
- Instant DCF Valuation: Quickly computes intrinsic value, net present value, and additional financial metrics.
- High-Precision Analysis: Leverages Arbor Realty Trust's actual financial data for accurate valuation results.
- Effortless Scenario Testing: Easily evaluate various assumptions and analyze different financial outcomes.
- Efficiency Booster: Streamlines the valuation process, removing the need to create intricate models from the ground up.
How It Works
- Download the Template: Gain immediate access to the Excel-based ABR DCF Calculator.
- Input Your Assumptions: Modify the yellow-highlighted cells for growth rates, WACC, margins, and other variables.
- Instant Calculations: The model automatically calculates Arbor Realty Trust’s intrinsic value.
- Test Scenarios: Experiment with different assumptions to assess potential valuation shifts.
- Analyze and Decide: Utilize the outcomes to inform your investment or financial assessment.
Why Choose Arbor Realty Trust, Inc. (ABR)?
- Streamlined Investment Process: Access comprehensive real estate investment insights without starting from square one.
- Enhanced Financial Accuracy: Dependable market data and robust calculations minimize valuation discrepancies.
- Customizable Solutions: Adjust the investment parameters to align with your financial strategies and forecasts.
- User-Friendly Interface: Intuitive visuals and outputs facilitate straightforward analysis of investment performance.
- Preferred by Industry Leaders: Crafted for investors who prioritize accuracy and efficiency in real estate transactions.
Who Should Use This Product?
- Investors: Evaluate Arbor Realty Trust’s (ABR) performance before making investment decisions.
- CFOs and Financial Analysts: Optimize valuation methodologies and validate financial forecasts.
- Real Estate Developers: Understand how publicly traded REITs like Arbor Realty Trust are assessed.
- Consultants: Provide comprehensive valuation analyses for clients in the real estate sector.
- Students and Educators: Utilize current market data to teach and practice real estate valuation principles.
What the Template Contains
- Operating and Balance Sheet Data: Pre-filled Arbor Realty Trust, Inc. (ABR) historical data and forecasts, including revenue, EBITDA, EBIT, and capital expenditures.
- WACC Calculation: A dedicated sheet for Weighted Average Cost of Capital (WACC), including parameters like Beta, risk-free rate, and share price.
- DCF Valuation (Unlevered and Levered): Editable Discounted Cash Flow models showing intrinsic value with detailed calculations.
- Financial Statements: Pre-loaded financial statements (annual and quarterly) to support analysis.
- Key Ratios: Includes profitability, leverage, and efficiency ratios for Arbor Realty Trust, Inc. (ABR).
- Dashboard and Charts: Visual summary of valuation outputs and assumptions to analyze results easily.
Disclaimer
All information, articles, and product details provided on this website are for general informational and educational purposes only. We do not claim any ownership over, nor do we intend to infringe upon, any trademarks, copyrights, logos, brand names, or other intellectual property mentioned or depicted on this site. Such intellectual property remains the property of its respective owners, and any references here are made solely for identification or informational purposes, without implying any affiliation, endorsement, or partnership.
We make no representations or warranties, express or implied, regarding the accuracy, completeness, or suitability of any content or products presented. Nothing on this website should be construed as legal, tax, investment, financial, medical, or other professional advice. In addition, no part of this site—including articles or product references—constitutes a solicitation, recommendation, endorsement, advertisement, or offer to buy or sell any securities, franchises, or other financial instruments, particularly in jurisdictions where such activity would be unlawful.
All content is of a general nature and may not address the specific circumstances of any individual or entity. It is not a substitute for professional advice or services. Any actions you take based on the information provided here are strictly at your own risk. You accept full responsibility for any decisions or outcomes arising from your use of this website and agree to release us from any liability in connection with your use of, or reliance upon, the content or products found herein.