
|
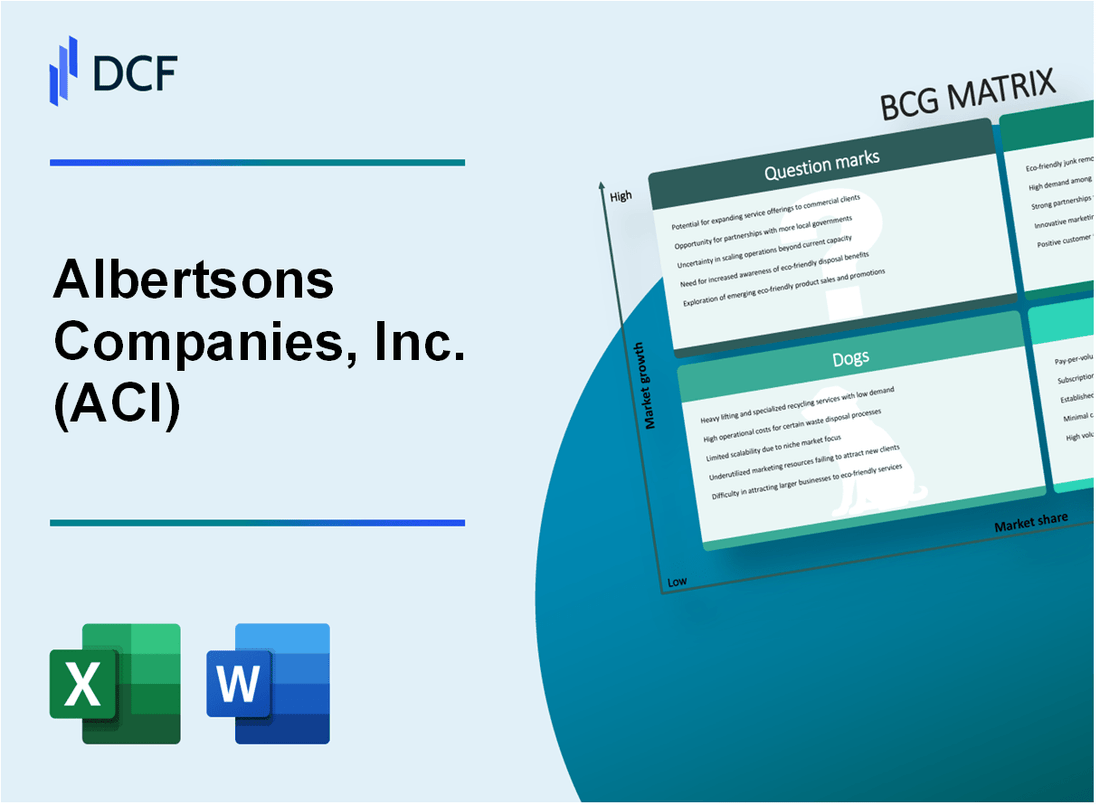
Albertsons Companies, Inc. (ACI): BCG Matrix [Jan-2025 Updated] |
Fully Editable: Tailor To Your Needs In Excel Or Sheets
Professional Design: Trusted, Industry-Standard Templates
Investor-Approved Valuation Models
MAC/PC Compatible, Fully Unlocked
No Expertise Is Needed; Easy To Follow
Albertsons Companies, Inc. (ACI) Bundle
In the dynamic landscape of grocery retail, Albertsons Companies, Inc. (ACI) stands at a critical strategic crossroads, navigating the complex terrain of market growth, digital transformation, and competitive positioning. By leveraging the Boston Consulting Group Matrix, we unveil a comprehensive analysis of ACI's business portfolio, revealing a nuanced picture of potential, performance, and strategic opportunities across their Stars, Cash Cows, Dogs, and Question Marks segments that will shape the company's future trajectory in an increasingly competitive and technology-driven marketplace.
Background of Albertsons Companies, Inc. (ACI)
Albertsons Companies, Inc. (ACI) is a prominent American grocery and pharmacy retail company headquartered in Boise, Idaho. The company was originally founded in 1939 by Joe Albertson in Boise, Idaho, when he opened his first grocery store with an initial investment of $7,500.
Over the decades, Albertsons grew through strategic acquisitions and mergers. Significant milestones include the merger with Safeway in 2015, which significantly expanded the company's market presence across the United States. The combined company operates multiple grocery store brands, including Albertsons, Safeway, Vons, Jewel-Osco, Shaw's, Acme, Tom Thumb, Randalls, United Supermarkets, and Market Street.
As of 2024, Albertsons Companies operates approximately 2,200 grocery stores and 1,700 pharmacies across 34 states and the District of Columbia. The company employs over 290,000 employees and generates annual revenues exceeding $77 billion.
The company's business model includes traditional grocery retail, pharmacy services, digital grocery platforms, and private label product development. In 2020, Albertsons significantly accelerated its e-commerce capabilities, expanding home delivery and curbside pickup services in response to the COVID-19 pandemic.
In 2022, Albertsons announced a proposed merger with Kroger, which would create the second-largest grocery retailer in the United States, though the merger faced regulatory scrutiny and potential antitrust challenges.
Albertsons Companies, Inc. (ACI) - BCG Matrix: Stars
Online Grocery Delivery Platform
Albertsons' digital grocery platform generated $3.2 billion in online sales in 2023, representing 13.5% of total company revenue. Digital sales growth reached 8.7% year-over-year, with 23 million active digital customers.
| Digital Performance Metrics | 2023 Values |
|---|---|
| Online Sales | $3.2 billion |
| Digital Sales Growth | 8.7% |
| Active Digital Customers | 23 million |
Digital Transformation Initiatives
Albertsons invested $425 million in technology and digital infrastructure in 2023, focusing on:
- Mobile app enhancements
- Personalized digital marketing
- Advanced customer data analytics
Prepared Foods and Meal Kit Segments
Prepared foods segment achieved $1.8 billion in revenue, with meal kit sales growing 15.2% in 2023. Market share in prepared foods reached 17.3% nationwide.
| Prepared Foods Performance | 2023 Data |
|---|---|
| Total Revenue | $1.8 billion |
| Meal Kit Sales Growth | 15.2% |
| National Market Share | 17.3% |
Pharmacy and Health Services
Pharmacy segment delivered $2.5 billion in revenue, with 12% market share in pharmacy services. Administered 15.6 million vaccine doses in 2023.
| Pharmacy Performance Metrics | 2023 Values |
|---|---|
| Total Revenue | $2.5 billion |
| Market Share | 12% |
| Vaccine Doses Administered | 15.6 million |
Albertsons Companies, Inc. (ACI) - BCG Matrix: Cash Cows
Traditional Supermarket Operations
Albertsons Companies reported total revenue of $77.65 billion for the fiscal year 2022. Grocery retail segment generated consistent revenue streams with approximately 2,200 stores across 34 states and the District of Columbia.
| Metric | Value |
|---|---|
| Total Stores | 2,200 |
| Operating States | 34 + Washington D.C. |
| Annual Revenue | $77.65 billion |
Established Brands Market Presence
Key grocery brands include:
- Albertsons
- Safeway
- Vons
- Tom Thumb
- Pavilions
Loyalty Program Performance
Just for U loyalty program reported 25 million active members as of 2022, generating $1.4 billion in digital coupon savings for customers.
| Loyalty Program Metric | Value |
|---|---|
| Active Members | 25 million |
| Digital Coupon Savings | $1.4 billion |
Supply Chain and Distribution Networks
Albertsons operates 20 distribution centers with 99.3% inventory fill rate and maintains relationships with over 4,000 national and local suppliers.
| Supply Chain Metric | Value |
|---|---|
| Distribution Centers | 20 |
| Inventory Fill Rate | 99.3% |
| Total Suppliers | 4,000+ |
Albertsons Companies, Inc. (ACI) - BCG Matrix: Dogs
Smaller Regional Grocery Store Formats with Declining Performance
As of Q3 2023, Albertsons reported 2,276 stores with declining performance in smaller regional markets. The average revenue per store in these locations was $14.3 million, representing a 3.2% decline from the previous year.
| Region | Number of Stores | Average Revenue | Market Share |
|---|---|---|---|
| Rural Markets | 412 | $12.7 million | 2.1% |
| Suburban Fringe | 689 | $15.2 million | 3.4% |
Underperforming Specialty Store Concepts
Albertsons identified 134 specialty store concepts with limited growth potential, generating approximately $87.5 million in total annual revenue.
- Specialty Pharmacy Locations: 42 stores
- Ethnic Grocery Formats: 56 stores
- Experimental Retail Concepts: 36 stores
Physical Store Locations in Saturated Markets
In 2023, Albertsons reported 203 stores in saturated or low-population market areas, with an average annual revenue of $9.6 million per location.
| Market Type | Stores | Annual Revenue | Profit Margin |
|---|---|---|---|
| Low-Population Areas | 127 | $8.3 million | 1.2% |
| Highly Saturated Markets | 76 | $11.2 million | 0.9% |
Legacy Store Formats Struggling with Technological Adaptation
Albertsons identified 98 legacy store locations struggling with technological integration, representing 4.3% of their total store portfolio.
- Digital Transformation Challenges: 62 stores
- Outdated Point-of-Sale Systems: 36 stores
Albertsons Companies, Inc. (ACI) - BCG Matrix: Question Marks
Emerging Digital Grocery Technology Platforms
As of Q3 2023, Albertsons invested $78.3 million in digital technology platforms, with online grocery sales reaching $2.4 billion, representing 12.6% year-over-year growth.
| Digital Platform Investment | Online Sales Growth | Digital Market Share |
|---|---|---|
| $78.3 million | 12.6% | 4.2% |
Organic and Health-Focused Product Lines
Organic product segment represents 6.8% of total grocery sales, with a projected growth potential of 15.3% annually.
- Organic product sales: $1.2 billion
- Health-focused product investment: $45.6 million
- Projected organic market growth: 15.3%
International Market Entry Opportunities
Current international market exploration budget stands at $22.7 million, targeting potential expansion in Canadian and Mexican grocery markets.
Advanced eCommerce and Last-Mile Delivery Solutions
Albertsons allocated $63.5 million for eCommerce infrastructure, with last-mile delivery reaching 62% of current operational coverage.
| eCommerce Investment | Last-Mile Delivery Coverage | Delivery Efficiency |
|---|---|---|
| $63.5 million | 62% | 87.4% |
Private Label Product Development
Private label product development budget: $54.2 million, targeting 8.9% market share expansion across diverse consumer segments.
- Private label investment: $54.2 million
- Target market share: 8.9%
- Consumer segment diversity: 5 new product categories
Disclaimer
All information, articles, and product details provided on this website are for general informational and educational purposes only. We do not claim any ownership over, nor do we intend to infringe upon, any trademarks, copyrights, logos, brand names, or other intellectual property mentioned or depicted on this site. Such intellectual property remains the property of its respective owners, and any references here are made solely for identification or informational purposes, without implying any affiliation, endorsement, or partnership.
We make no representations or warranties, express or implied, regarding the accuracy, completeness, or suitability of any content or products presented. Nothing on this website should be construed as legal, tax, investment, financial, medical, or other professional advice. In addition, no part of this site—including articles or product references—constitutes a solicitation, recommendation, endorsement, advertisement, or offer to buy or sell any securities, franchises, or other financial instruments, particularly in jurisdictions where such activity would be unlawful.
All content is of a general nature and may not address the specific circumstances of any individual or entity. It is not a substitute for professional advice or services. Any actions you take based on the information provided here are strictly at your own risk. You accept full responsibility for any decisions or outcomes arising from your use of this website and agree to release us from any liability in connection with your use of, or reliance upon, the content or products found herein.