
|
Accor SA (AC.PA): PESTLE Analysis [Apr-2026 Updated] |
Fully Editable: Tailor To Your Needs In Excel Or Sheets
Professional Design: Trusted, Industry-Standard Templates
Investor-Approved Valuation Models
MAC/PC Compatible, Fully Unlocked
No Expertise Is Needed; Easy To Follow
Accor SA (AC.PA) Bundle
Accor stands at a pivotal moment: a digitally savvy, globally diversified portfolio and a 100‑million‑member loyalty base position it to capture booming Asian demand, wellness and 'bleisure' travel, and higher‑margin MICE and luxury stays, while IoT, AI and renewable initiatives cut costs and boost guest satisfaction-but rising regulatory and compliance burdens, heavy decarbonization and retrofit capex, labor and tax headwinds, currency swings and regional geopolitical shocks threaten margins and growth, making execution on sustainability, tech integration and selective expansion into fast‑growing markets the company's strategic imperative.
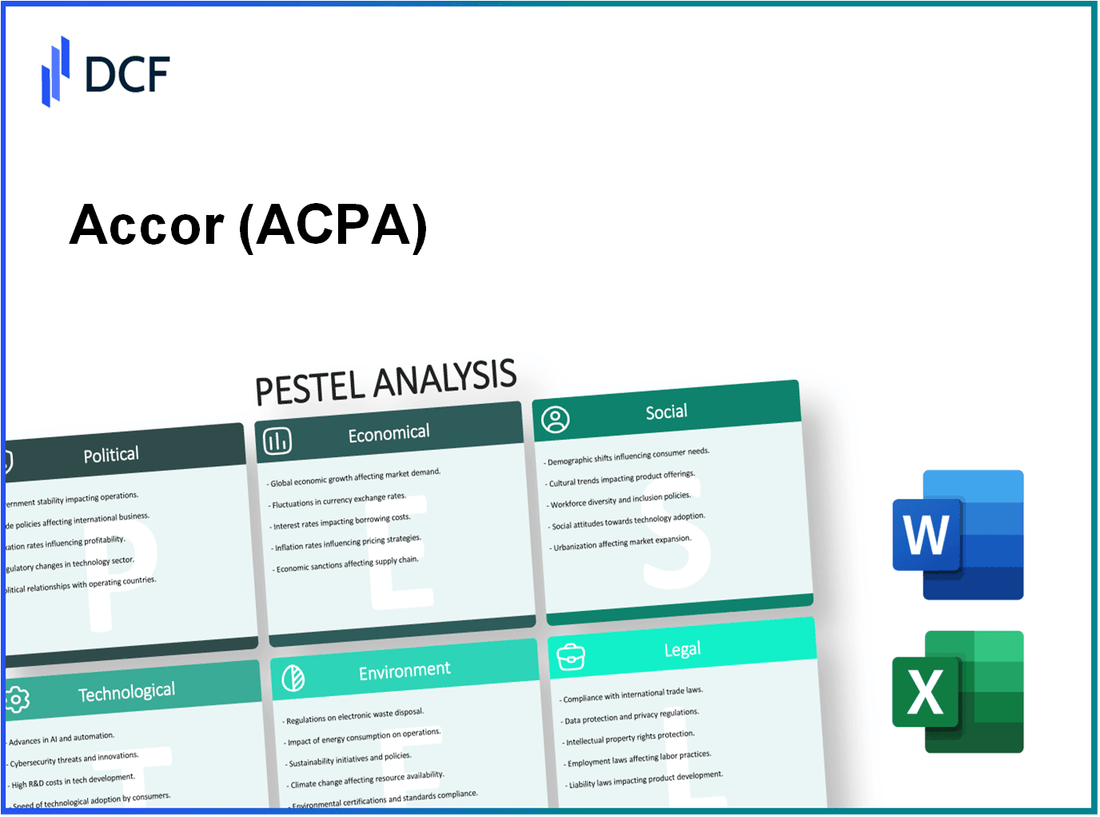
Accor SA (AC.PA) - PESTLE Analysis: Political
Geopolitical instability in the Middle East and adjacent regions has a demonstrable negative effect on Accor's revenue from affected destinations. For example, arrivals to key Middle Eastern markets declined by 18-35% during recent conflict periods (quarterly comparisons), leading to localized RevPAR declines of 12-28% in affected cities. Accor operates approximately 150 hotels in the region (approx. 20,000 rooms), exposing group earnings to episodic demand shocks and insurance cost increases of an estimated +3-6% on regional property coverages.
Visa liberalization across Asia-Pacific and bilateral air service agreements have materially increased outbound travel. Markets that liberalized short-term tourist visas saw outbound departures grow by 7-14% year-on-year within 12 months post-implementation. Accor's portfolio exposure: ~1,200 hotels in Asia-Pacific (approx. 200,000 rooms), generating ~30-40% of group EBITDA pre-COVID; incremental demand from visa facilitation has supported average occupancy uplifts of 2-6 percentage points in gateway cities.
EU trade regulation and regulatory alignment (including EU Green Deal-related measures) are reshaping European hotel supply costs. New rules impacting energy efficiency, waste management and procurement have been linked to a projected 4-9% uplift in operating expenditure for full-service hotels over a 5-year horizon. Specific cost drivers: energy compliance CAPEX of €2,000-€10,000 per room depending on retrofit scope, and annual energy cost increases averaging €120-€420 per room under stricter standards.
| Political Factor | Direct Impact on Accor | Quantitative Indicator | Time Horizon |
|---|---|---|---|
| Middle East Geopolitical Instability | Demand shocks; higher insurance and security costs | Arrivals down 18-35%; RevPAR -12-28%; Insurance +3-6% | Short to medium (0-2 years) |
| Asia-Pacific Visa Liberalization | Increased outbound travel; occupancy gains | Outbound departures +7-14%; Occupancy +2-6 p.p.; Portfolio: ~200k rooms | Medium (1-3 years) |
| EU Trade & Environmental Regulations | Higher OPEX and CAPEX for compliance | OPEX +4-9%; CAPEX €2k-€10k per room | Medium to long (2-7 years) |
| Global Tax Reform (OECD Pillar Two) | Higher effective tax rate; reduced net profit | Minimum tax 15% effective from 2023-2024; potential ETR increase 1-3 p.p. | Immediate to medium (1-3 years) |
| Labor Mobility & Immigration Policy | Staff shortages or surpluses; wage pressure | Hospitality vacancy rates 10-18% in tight markets; wage inflation 3-7% p.a. | Short to medium (0-3 years) |
Global tax reforms, notably the OECD/G20 Inclusive Framework and Pillar Two minimum tax (15%), create potential upward pressure on Accor's consolidated effective tax rate. Preliminary modeling indicates an ETR increase of roughly 1-3 percentage points for multinational hotel operators with widespread low-tax jurisdictions; incremental tax expense could reduce free cash flow by an estimated €20-€60 million annually depending on geographic profit mix.
Labor mobility and immigration policies directly affect Accor's staffing model in markets with heavy reliance on international labor. In high-dependency markets, hospitality vacancy rates range from 10% to 18%, driving annual wage inflation of approximately 3-7% and raising recruitment and training costs by €500-€1,500 per new hire. Changes to work-permit regimes or seasonal worker programs can shift operating margins by 0.5-1.5 percentage points in affected regions.
- Risk mitigation: portfolio diversification across 110+ countries reduces single-market political exposure; franchise/light-asset model limits capital at risk in volatile jurisdictions.
- Opportunities: targeted growth in visa-liberalized corridors and partnerships with national tourism boards to capture pent-up outbound demand.
- Costs to monitor: compliance CAPEX for EU regulations, insurance premia in unstable regions, and effective tax burden under global minimum tax rules.
Accor SA (AC.PA) - PESTLE Analysis: Economic
European Central Bank (ECB) policy and global debt market conditions materially constrain Accor's expansion and profitability. With the ECB policy rate at 4.00% (December 2025) and euro-area sovereign yields elevated (10-year German Bund ~2.80%), borrowing costs for developers, franchisees and Accor's own balance-sheet investments remain higher than in the 2010s. Accor's net debt of EUR 2.8bn (FY2024 pro forma) and available committed facilities mean refinancing costs and new investment hurdle rates have increased by an estimated 150-300 basis points relative to pre-tightening levels, compressing IRRs on ground-up assets and slowing conversion of management and lease contracts into profitable openings.
Key metrics:
| Metric | Value | Source/Note |
| ECB main refinancing rate | 4.00% | Dec 2025 policy |
| 10Y German Bund yield | ~2.80% | Market snapshot |
| Accor net debt (pro forma) | EUR 2.8bn | FY2024 reporting |
| WACC impact vs 2019 | +150-300 bps | Industry estimate |
Emerging markets increasingly fuel Accor's portfolio diversification and growth, offsetting softer Western Europe leisure performance in certain cycles. By FY2024, Accor's pipeline concentration outside Europe rose to ~46% of rooms under development, with Asia Pacific and Middle East & Africa accounting for ~33% and ~8% respectively. Revenue growth in these markets has averaged 6-10% CAGR over 2019-2024 for branded-management and franchise fees, driven by domestic demand, rising intra-regional travel and rising private investment. Expansion in emerging markets reduces dependence on mature-market RevPAR recovery timing but exposes Accor to localized political and macro volatility.
Regional portfolio metrics:
| Region | Rooms in operation (approx.) | Rooms in pipeline (%) | Revenue growth FY2019-FY2024 (approx.) |
| Europe | ~230,000 | ~34% | 3-5% CAGR |
| Asia Pacific | ~120,000 | ~21% | 6-10% CAGR |
| Middle East & Africa | ~60,000 | ~8% | 5-9% CAGR |
| Americas | ~70,000 | ~37% | 4-7% CAGR |
Luxury demand shifts with global wealth distribution and aviation costs. Ultra-luxury and lifestyle segments show higher sensitivity to global high-net-worth population trends and international air travel costs. Global UHNW population grew ~7% CAGR (2019-2024) concentrated in North America and Asia, supporting high-end booking windows and ADRs. Conversely, sustained jet fuel volatility (jet fuel price range 2019-2025: USD 0.60-1.20/litre equivalent) and higher airline fares compress international transient travel and lengthen stay patterns among premium travellers, affecting occupancy mix and corporate travel-derived demand. Accor's luxury brands (Raffles, Sofitel Legend, Fairmont partnership regions) reported ADR premiums of 35-65% above portfolio average but greater RevPAR volatility in travel-shock scenarios.
Relevant figures:
- UHNW population growth (2019-2024): ~+7% CAGR
- Luxury ADR premium vs portfolio average: 35-65%
- Jet fuel price range (2019-2025): USD 0.60-1.20/litre equivalent
Currency fluctuations materially affect Accor's reported revenues and margins. With ~55-60% of group fees and revenues earned outside the eurozone and corporate reporting in euros, a stronger euro vs USD, AUD or CNY can reduce euro-reported top-line and compress euro-denominated margin targets. FY2024 foreign exchange translation effects on revenue were estimated at -2.0% to +1.5% range year-over-year depending on major cross rates. Natural hedging from locally denominated costs helps but fee income (management/franchise fees linked to local RevPAR) and real estate-related payments create recurring translation and transaction exposure.
FX exposure snapshot:
| Currency | Share of non-euro revenue (%) | Typical exposure effect on EUR revenue (1% move) |
| USD | ~22% | ~0.2-0.3% impact |
| AUD | ~6% | ~0.05-0.1% impact |
| CNY | ~7% | ~0.06-0.12% impact |
Inflation and wage dynamics press hotel labor costs across markets. Euro-area inflation has averaged ~4.5% (2022-2024) and local CPI in several emerging markets exceeded 6-8% in the same period, forcing above-inflation wage adjustments to retain staff in hospitality. Labor typically represents 25-35% of hotel operating expenses for full-service properties; a 3-5% annual increase in wages can erode GOP margins by 1.5-3.0 percentage points absent yield management and F&B margin recovery. Accor's cost-transformation targets and automation initiatives aim to offset part of this pressure, but collective bargaining and minimum-wage legislation in key markets create step-up risks to payroll expense profiles.
Labor and inflation impacts:
- Typical labor cost share (full-service hotel): 25-35% of OPEX
- Euro-area CPI (2022-2024 avg): ~4.5%
- Emerging market CPI examples: Indonesia 3-6%, Brazil 4-7%, India 4-8% (varies by year)
- Estimated GOP margin erosion from 3-5% wage inflation: 1.5-3.0 pp
Accor SA (AC.PA) - PESTLE Analysis: Social
Demographic shifts and evolving consumer preferences are reshaping demand for Accor's portfolio. Younger generations-millennials and Gen Z-are driving strong growth in experiential and lifestyle travel: industry surveys indicate 60-75% of these cohorts prioritize experiences over possessions, translating into higher occupancy and ADR potential in lifestyle, boutique and branded-lifestyle segments. For Accor (2023 group RevPAR growth and brand investments), this has meant accelerated roll-out of lifestyle brands (25+ lifestyle brands across the portfolio) and targeted marketing to guests aged 25-44, who represent an estimated 35-45% of urban leisure spend in key markets.
Wellness and sleep-focused amenities have migrated from niche to mainstream. The global wellness economy (wellness tourism subsegment) has been expanding at a material rate; wellness tourism expenditure has been reported to outpace general tourism growth with multi-year CAGRs in the mid-to-high single digits. For Accor, integrating sleep-centric room products, in-room wellness partnerships, and spa/fitness offerings is increasingly revenue-generative: wellness add-ons and premium room upsells can increase ancillary revenue per room by an estimated €5-€15/night in mature markets.
Urbanization trends increase demand for flexible-stay formats. UN urbanization data indicates over 55% of the global population lives in urban areas, with continued urban migration. This fuels demand for micro-stays, co-working hotels and short-duration bookings in city centers-formats in which Accor has invested through brands and digital platforms. Short-stay conversion rates and weekday occupancy improvements from co-working offerings have been shown to increase urban hotel RevPAR by 3-8% versus traditional room-only models in comparable locations.
Social diversity, equity and inclusion (DEI) commitments materially influence brand selection among corporate clients and younger consumers. Corporate sourcing policies increasingly require supplier diversity and EDI reporting; 40-60% of large corporate travel programs now include sustainability and social governance criteria when selecting hotel partners. Accor's published targets on workforce diversity and supplier inclusion influence RFP outcomes in key corporate accounts and group bookings, with potential contract value swings in the low- to mid-single-digit millions for major corporate customers.
Reputation risks tied to perceived greenwashing have direct revenue and valuation implications. Guest sentiment and social media amplify claims of inconsistent sustainability practices; hotels accused of greenwashing experience occupancy dips and negative review impact. Brand trust metrics and NPS correlate with occupancy and ADR: a sustained 10-point drop in brand NPS can reduce RevPAR by an estimated 5-7% in affected markets. For asset-light franchise models like Accor's, brand reputation directly affects franchise sales, management contract renewals and conversion rates.
| Social Trend | Key Metrics / Data | Implication for Accor |
|---|---|---|
| Younger generations prefer experiential luxury | 25-44 age cohort = 35-45% of urban leisure spend; 60-75% prioritize experiences | Expand lifestyle brands, curated experiences; potential ADR premium of 5-15% |
| Wellness and sleep-focused mainstreaming | Wellness tourism CAGR mid-to-high single digits; ancillary revenue €5-€15/night | Integrate wellness room features, partnerships, increase ancillary revenues |
| Urbanization → micro-stays & co-working | Urban population >55%; urban hotel RevPAR uplift 3-8% with flexible formats | Deploy micro-stay pricing, mixed-use public spaces, target weekday demand |
| Social diversity commitments | 40-60% of large corporate programs include EDI/sustainability criteria | Strengthen DEI reporting, supplier diversity programs to secure corporate accounts |
| Greenwashing reputation risk | 10-point NPS drop → RevPAR decline ~5-7% in impacted markets | Ensure transparent sustainability reporting; third-party verification to protect brand |
Operational and revenue levers Accor can deploy include:
- Product: rollout branded lifestyle and sleep-enhanced room categories across core urban and resort assets.
- Services: scale wellness partnerships (spa, nutrition, sleep tech) and monetize through premium upsells.
- Digital: target 25-44 cohort via data-driven personalization and experience bundles to lift direct bookings.
- Corporate: integrate DEI and social-impact metrics into corporate contracting to retain high-value accounts.
- Communications: adopt verified sustainability disclosures and third-party certifications to mitigate greenwashing exposure.
Performance indicators to monitor: RevPAR and ADR by lifestyle vs. traditional segments, ancillary revenue per occupied room (ARRPOR), weekday vs. weekend occupancy in urban hotels, brand NPS and social sentiment scores, percentage of bookings from 25-44 demographic, and compliance metrics for EDI and sustainability certifications.
Accor SA (AC.PA) - PESTLE Analysis: Technological
AI and data analytics are embedded across Accor's revenue management, loyalty and marketing stacks to optimize pricing, distribution and conversion rates. Machine learning-driven dynamic pricing engines analyze historical demand, channel costs and local events to adjust room rates in real time, targeting RevPAR uplifts of 3-8% where deployed. Predictive analytics for demand forecasting reduces forecasting error by up to 20% versus traditional methods, improving staffing and inventory decisions. Loyalty-driven personalization leverages guest profiles and behavioral data to increase direct booking conversion and ancillary spend (F&B, spa) by 10-25% in pilot programs.
| Capability | Function | Measured Impact | Deployment Example |
| Dynamic pricing (AI) | Real‑time rate adjustments | RevPAR +3-8% | Revenue management engine connected to PMS and channel manager |
| Predictive demand forecasting | Staffing & inventory planning | Forecast error -20% | Regional forecasting model across 5,400+ properties |
| Customer propensity scoring | Targeted offers and upsell | Ancillary spend +10-25% | Loyalty program personalization |
Digital key, VR and mobile channels are reshaping guest journeys from booking to checkout. Mobile apps and digital keys reduce front‑desk friction - pilot sites reported check‑in/check‑out time reductions of 60-90 seconds per guest and increased guest satisfaction (NPS improvements of 5-12 points). Virtual reality and 360° tours increase time-on-page and booking intent on hotel pages; conversion lift in A/B tests ranges 5-15%. Mobile channels (apps, progressive web apps) drive higher direct booking margins: mobile direct bookings typically carry 10-30% lower distribution cost compared with OTAs when accounting for commission and marketing spend.
- Digital key adoption: contactless room access across select brands and 1,000+ rooms in 2023 pilots.
- Mobile bookings share: mobile and app channels represent an estimated 40-60% of direct bookings in mature markets.
- VR/immersive content: used for premium suites and MICE venues to shorten sales cycles by 10-20%.
IoT and smart‑building technologies are deployed to reduce energy consumption and improve guest comfort. Smart HVAC, lighting and occupancy sensors enable demand‑driven control that can reduce hotel energy use by 10-25% and lower carbon intensity (kg CO2e per room night). Integrations with property management systems and building management systems allow predictive maintenance, reducing unplanned downtime and maintenance costs by up to 15-30% for monitored equipment.
| IoT Element | Primary Benefit | Quantified Outcome | System Integration |
| Occupancy sensors & smart HVAC | Energy optimization | Energy -10-25% | PMS + BMS integration |
| Predictive maintenance sensors | Asset uptime | Maintenance cost -15-30% | CMMS + vendor portals |
| Guest comfort controls (in‑room) | Personalization & satisfaction | NPS +3-8 points | Guest app + room IoT hub |
Blockchain, digital wallets and smart contracts are being explored to modernize transactions, streamline B2B reconciliation and enable tokenized loyalty. Use cases include cross‑border payments with reduced FX and settlement time (near real‑time versus T+1-T+3 bank settlements), automated commission flows for franchise and management agreements via smart contracts, and tokenized loyalty points exchangeable across brands and partners. Early pilots indicate potential reductions in payment reconciliation time by 50-80% and lower intermediary fees for selected corridors by 0.5-2.0 percentage points.
- Blockchain pilots: payment rails and loyalty token trials with travel partners.
- Smart contracts: automating franchise fee triggers and performance‑linked payouts.
- Digital wallets: pilot acceptance in high‑volume markets to reduce card fees and FX exposure.
Cybersecurity and data privacy governance remain persistent priorities given Accor's scale (millions of guest records across >5,400 properties) and sensitive payment/PMS data flows. Regulatory regimes (GDPR, local data localization rules) require multi‑jurisdictional compliance, regular DPIAs and breach response plans. Investments include centralized security operations centers (SOCs), multi‑factor authentication, tokenization of card data, and encryption of PII in transit and at rest. Key metrics tracked: time to detect (MTTD target <24 hours), time to contain (MTTC target <72 hours), percentage of properties with GDPR‑compliant consent flows (target >95%), and yearly vulnerability remediation rate (aim >90% within 30 days).
| Security Area | Controls | Operational Targets | Regulatory Focus |
| Data protection | Encryption, tokenization, DLP | PII encrypt rate >98% | GDPR, local privacy laws |
| Detection & response | SOC, EDR, SIEM | MTTD <24h; MTTC <72h | Incident notification timelines |
| Third‑party risk | Vendor assessments, SLAs | Vendor remediation >90% within 30 days | Data processor contracts |
Accor SA (AC.PA) - PESTLE Analysis: Legal
CSRD and GDPR updates raise compliance costs and risk: The EU Corporate Sustainability Reporting Directive (CSRD) extends mandatory sustainability reporting to large companies and listed groups; Accor, with FY2024 revenue ~€6.0 billion and ~5,000 hotels under management/franchise, faces expanded non-financial disclosure obligations covering environmental, social and governance (ESG) metrics. Estimated incremental compliance costs for large hospitality groups range from €10-30 million annually for systems, assurance and reporting processes. GDPR enforcement carries fines up to 4% of global turnover (up to ~€240 million based on FY2024 turnover for a larger hospitality peer), and increased regulatory scrutiny of guest data processing, booking platforms, and loyalty programs elevates legal risk and potential remediation costs.
Labor laws increase payroll and operational complexities: National variations in minimum wage, collective bargaining outcomes and working-time regulations across 60+ operating countries create payroll volatility. In France, recent minimum wage and social charge adjustments increased labor costs by an estimated 3-5% year-over-year for hotel operations. Accor's workforce mix-direct employees (~150,000) plus local staff employed by franchisees and owners-means changes to labor law (e.g., stricter overtime rules, mandatory benefits) can raise recurring operating expenses materially; projected additional annual payroll and compliance costs can exceed €50-150 million under adverse multi-jurisdictional reforms.
IP, branding, and advertising regulations tighten brand governance: Strengthened advertising standards, digital platform transparency rules, and trademark enforcement variability require tighter brand control across franchised and managed properties. Brand infringement incidents (estimated tens to hundreds per year globally for major hotel brands) necessitate legal action and monitoring platforms costing up to €2-5 million annually. Contractual clauses with franchisees and owners must be continually revised to ensure IP protection, consistent quality standards, and liability allocation under local consumer protection laws.
Health, safety, and fire standards require significant capital: Stricter building safety, fire prevention codes and health regulations-accelerated after incidents in several jurisdictions-mandate capital upgrades across older assets. For a typical mid-sized hotel retrofit (fire suppression, alarm systems, accessibility upgrades), capital expenditure ranges €200k-€1.5M per property depending on scale and local requirements. If Accor needs to upgrade 15% of its ~5,000 hotels within a regulatory window, aggregate capex could range €150-€1.125 billion. Non-compliance risks include closure orders, fines (from thousands to millions of euros per incident) and reputational damage affecting RevPAR (revenue per available room).
Employment classification rules impact labor provisioning: Tightening of independent contractor and gig-economy classifications in key markets (EU, UK, Australia, parts of the US) affects use of casual labor in housekeeping, F&B and platform-based services. Reclassification can trigger retroactive liabilities for payroll taxes, benefits and social contributions; precedents in hospitality have led to back-pay claims averaging €5k-€20k per worker plus penalties. For Accor, reclassification of even 1% of non-direct workforce (several thousand workers) could produce contingent liabilities in the tens of millions of euros and require restructuring of operating models and franchise agreements.
| Legal Area | Key Regulatory Change | Primary Impact on Accor | Estimated Financial Effect |
|---|---|---|---|
| CSRD | Expanded sustainability reporting | Higher reporting, assurance costs; governance changes | €10-30M p.a. incremental |
| GDPR | Stricter data protection enforcement | Fines, breach remediation, system upgrades | Up to 4% of global turnover; remediation €1-20M per major incident |
| Labor Laws | Minimum wage and social charge increases | Higher payroll; scheduling complexity | 3-5% payroll increase; €50-150M p.a. possible |
| IP & Advertising | Digital advertising transparency; trademark enforcement | Monitoring, legal actions, contract revisions | €2-5M p.a. monitoring/legal |
| Health & Safety | Stricter fire/building codes | Capital refurbishments; temporary closures | €200k-€1.5M per property; €150-1.125B aggregate |
| Employment Classification | Reclassification of contractors | Retroactive liabilities; restructuring | €5k-20k per worker potential; tens of millions total |
Operational responses and legal controls include:
- Strengthening centralized compliance functions and external assurance for CSRD and GDPR;
- Updating franchise and management contracts to allocate regulatory compliance responsibilities and IP protections;
- Budgeting multi-year capex for mandatory safety upgrades and retrofits;
- Implementing standardized HR policies, workforce classification audits and contingency reserves for back-pay and fines.
Accor SA (AC.PA) - PESTLE Analysis: Environmental
Accor operates a global portfolio of approximately 5,500 hotels and ~760,000 rooms (2023), exposing the company to direct and indirect environmental risks and regulatory pressure across jurisdictions. Ambitious decarbonization targets - including a corporate commitment to reach Net Zero by 2050 and intermediate science-based targets validated for 2030 - are driving materially higher capital expenditure on energy-efficiency renovations, electrification and fuel-switching across owned and managed assets.
Ambitious decarbonization targets drive capex for renovations
To meet decarbonization goals, Accor is accelerating retrofits (HVAC, insulation, LED lighting, building management systems) and electrification of heating and cooking systems. Typical incremental capex to upgrade a midscale hotel room and common areas for energy-efficiency ranges from an estimated €500-€2,000 per room depending on scope; whole-hotel deep retrofit projects commonly run into €0.5-3.0 million per property for limited-service to full-service conversions. Across the portfolio, a sustained renovation program implies annual incremental capex pressure on owners and managed hotels and a reallocation of franchise/management fees and sustainability funds.
Biodiversity and coastal regulations limit development
Restrictions on coastal development, protected-area permitting and biodiversity offset requirements constrain pipeline expansion in hotspot destinations (Mediterranean, Caribbean, Southeast Asia). New-build projects near sensitive habitats face longer permitting lead times (often +6-24 months) and mandatory mitigation measures that can increase project costs by 5-30% or require compensation payments, while certain jurisdictions prohibit development in high-risk zones.
Waste reduction and circular economy extend supply chain reforms
Waste-reduction mandates and corporate circular-economy targets are altering procurement and operations. Accor's initiatives (food-waste prevention, single-use plastic reduction, recycling and reuse programs) cascade into supplier requirements for packaging, ingredient sourcing, laundry and amenities. Metrics used to monitor progress include waste diversion rates, food-waste kg/cover, and single-use plastic reduction percentages; typical hotel-level targets are 30-70% waste diversion by 2025-2030 depending on local infrastructure.
Renewable energy adoption and green power purchase expand
Accor is expanding on-site renewable installations (solar PV on rooftops/parking) and corporate/virtual power purchase agreements (PPAs) where feasible to decarbonize Scope 2 emissions. On-site solar yields vary (200-600 kWh per kW installed annually by geography). PPAs and green tariffs contribute to risk mitigation against volatile fossil-fuel energy prices and support meeting SBTi-aligned electricity decarbonization paths; contracting green power can reduce reported Scope 2 emissions by 70-100% for the covered load.
Water scarcity and sustainability mandates reshape operations
Water stress in key markets (Mediterranean, Middle East, parts of Asia-Pacific, western US) is pushing investments in low-flow fixtures, linen reuse programs and greywater/effluent reuse where regulation permits. Operational targets commonly aim for 20-40% reductions in water intensity (m3/room-night) by 2030 versus baseline years. Compliance with municipal water restrictions and hospitality-specific permits may also limit pool/horticulture operations and increase costs for desalination or treatment technologies where municipal supply is unreliable.
| Environmental Issue | Operational Impact | Estimated Cost / Metric | Timeline / Target Examples |
|---|---|---|---|
| Decarbonization (Energy efficiency & electrification) | Renovation capex, retrofits, BMS upgrades, fuel-switch | €500-€2,000 per room (retrofit range); €0.5-3.0M per property deep retrofit | Net Zero by 2050; science-based 2030 intermediate targets (validated) |
| Renewable energy (on-site & PPAs) | Capital for PV, battery storage; PPA/contract complexity | Solar yield 200-600 kWh/kW-yr; PPAs can offset 70-100% Scope 2 for contracted load | Progressive rollout by region aligned to 2030 electricity targets |
| Water scarcity | Reduced availability, higher operating costs, treatment investments | Targets: 20-40% reduction in m3/room-night by 2030; desalination/treatment CAPEX varies | Regional compliance and voluntary reduction targets through 2030 |
| Waste & circular economy | Procurement changes, supplier engagement, waste segregation infrastructure | Waste diversion targets commonly 30-70% by 2025-2030; food-waste reduction KPIs in kg/cover | Progressive supplier requirements and corporate targets toward 2030 |
| Biodiversity & land-use constraints | Project delays, mitigation/offset costs, restricted development | Permit delays +6-24 months; mitigation costs +5-30% of development cost | Local regulatory regimes enforced continuously; pre-development biodiversity assessments required |
Environmental priorities translate into practical operational actions and risk management across Accor's network:
- Energy: roll-out of LED lighting, smart BMS, high-efficiency HVAC, electrification of kitchens and heating.
- Procurement: supplier sustainability clauses, bulk amenity reuse models, elimination of single‑use plastics.
- Waste: food-waste prevention programs, on-site composting where permitted and centralized recycling contracts.
- Water: low-flow fixtures, linen/towel reuse programs, rainwater harvesting and greywater reuse in water-stressed markets.
- Biodiversity: pre-construction impact assessments, habitat restoration and offset mechanisms for sensitive sites.
Key environmental risks that will affect financials and operations include increased renovation capex pressure on owners and franchisees, higher operating costs in water-stressed or high-compliance jurisdictions, potential revenue impacts from development-restricted destinations, and reputational costs if sustainability targets are not met. Offsetting these risks are potential benefits: lower energy operating expenditures post-retrofit (typical payback periods 3-8 years depending on measures), stronger brand preference among sustainability-conscious guests, and access to green financing or incentives in many markets.
Disclaimer
All information, articles, and product details provided on this website are for general informational and educational purposes only. We do not claim any ownership over, nor do we intend to infringe upon, any trademarks, copyrights, logos, brand names, or other intellectual property mentioned or depicted on this site. Such intellectual property remains the property of its respective owners, and any references here are made solely for identification or informational purposes, without implying any affiliation, endorsement, or partnership.
We make no representations or warranties, express or implied, regarding the accuracy, completeness, or suitability of any content or products presented. Nothing on this website should be construed as legal, tax, investment, financial, medical, or other professional advice. In addition, no part of this site—including articles or product references—constitutes a solicitation, recommendation, endorsement, advertisement, or offer to buy or sell any securities, franchises, or other financial instruments, particularly in jurisdictions where such activity would be unlawful.
All content is of a general nature and may not address the specific circumstances of any individual or entity. It is not a substitute for professional advice or services. Any actions you take based on the information provided here are strictly at your own risk. You accept full responsibility for any decisions or outcomes arising from your use of this website and agree to release us from any liability in connection with your use of, or reliance upon, the content or products found herein.