
|
Acurx Pharmaceuticals, Inc. (ACXP) DCF Valuation |
Fully Editable: Tailor To Your Needs In Excel Or Sheets
Professional Design: Trusted, Industry-Standard Templates
Investor-Approved Valuation Models
MAC/PC Compatible, Fully Unlocked
No Expertise Is Needed; Easy To Follow
Acurx Pharmaceuticals, Inc. (ACXP) Bundle
Looking to assess Acurx Pharmaceuticals, Inc.'s intrinsic value? Our ACXP DCF Calculator integrates real-world data with comprehensive customization features, enabling you to adjust forecasts and enhance your investment strategies.
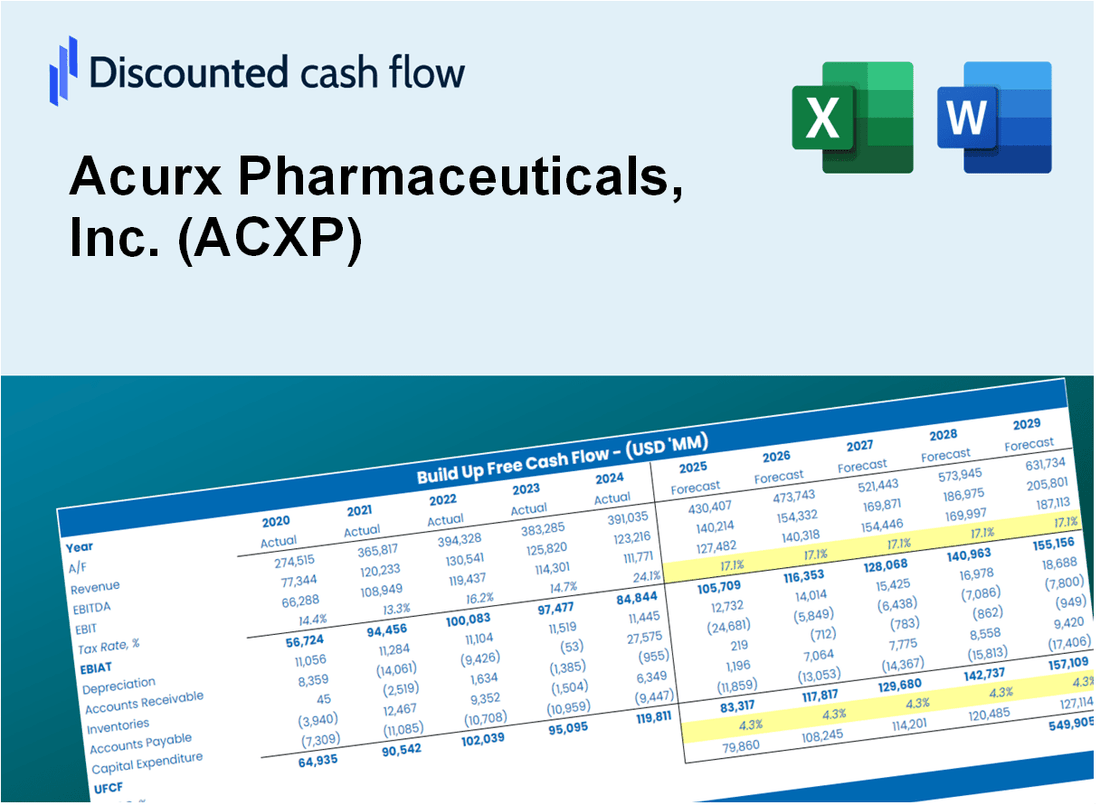
Discounted Cash Flow (DCF) - (USD MM)
| Year | AY1 2020 |
AY2 2021 |
AY3 2022 |
AY4 2023 |
AY5 2024 |
FY1 2025 |
FY2 2026 |
FY3 2027 |
FY4 2028 |
FY5 2029 |
|---|---|---|---|---|---|---|---|---|---|---|
| Revenue | .0 | .0 | .0 | .0 | .0 | .0 | .0 | .0 | .0 | .0 |
| Revenue Growth, % | 0 | 0 | 0 | 0 | 0 | 0 | 0 | 0 | 0 | 0 |
| EBITDA | .0 | -12.8 | -12.1 | -14.6 | .0 | .0 | .0 | .0 | .0 | .0 |
| EBITDA, % | 100 | 100 | 100 | 100 | 100 | 100 | 100 | 100 | 100 | 100 |
| Depreciation | 4.6 | .0 | .0 | .0 | 14.1 | .0 | .0 | .0 | .0 | .0 |
| Depreciation, % | 100 | 100 | 100 | 100 | 100 | 100 | 100 | 100 | 100 | 100 |
| EBIT | -4.6 | -12.8 | -12.1 | -14.6 | -14.1 | .0 | .0 | .0 | .0 | .0 |
| EBIT, % | 100 | 100 | 100 | 100 | 100 | 100 | 100 | 100 | 100 | 100 |
| Total Cash | 3.2 | 13.0 | 9.1 | 7.5 | 3.7 | .0 | .0 | .0 | .0 | .0 |
| Total Cash, percent | .0 | .0 | .0 | .0 | .0 | .0 | .0 | .0 | .0 | .0 |
| Account Receivables | .0 | .0 | .0 | .1 | .1 | .0 | .0 | .0 | .0 | .0 |
| Account Receivables, % | 100 | 100 | 100 | 100 | 100 | 100 | 100 | 100 | 100 | 100 |
| Inventories | .0 | .0 | .0 | .0 | .0 | .0 | .0 | .0 | .0 | .0 |
| Inventories, % | 100 | 100 | 100 | 100 | 100 | 100 | 100 | 100 | 100 | 100 |
| Accounts Payable | .0 | .0 | .0 | .0 | .0 | .0 | .0 | .0 | .0 | .0 |
| Accounts Payable, % | 100 | 100 | 100 | 100 | 100 | 100 | 100 | 100 | 100 | 100 |
| Capital Expenditure | .0 | .0 | .0 | .0 | .0 | .0 | .0 | .0 | .0 | .0 |
| Capital Expenditure, % | 100 | 100 | 100 | 100 | 100 | 0 | 0 | 0 | 0 | 0 |
| Tax Rate, % | 0 | 0 | 0 | 0 | 0 | 0 | 0 | 0 | 0 | 0 |
| EBITAT | -4.6 | -12.8 | -12.1 | -14.6 | -14.1 | .0 | .0 | .0 | .0 | .0 |
| Depreciation | ||||||||||
| Changes in Account Receivables | ||||||||||
| Changes in Inventories | ||||||||||
| Changes in Accounts Payable | ||||||||||
| Capital Expenditure | ||||||||||
| UFCF | .0 | -12.8 | -12.1 | -14.7 | .1 | .1 | .0 | .0 | .0 | .0 |
| WACC, % | 4.68 | 4.68 | 4.68 | 4.68 | 4.68 | 4.68 | 4.68 | 4.68 | 4.68 | 4.68 |
| PV UFCF | ||||||||||
| SUM PV UFCF | .0 | |||||||||
| Long Term Growth Rate, % | 2.00 | |||||||||
| Free cash flow (T + 1) | 0 | |||||||||
| Terminal Value | 0 | |||||||||
| Present Terminal Value | 0 | |||||||||
| Enterprise Value | 0 | |||||||||
| Net Debt | -4 | |||||||||
| Equity Value | 4 | |||||||||
| Diluted Shares Outstanding, MM | 1 | |||||||||
| Equity Value Per Share | 4.41 |
What You Will Get
- Real Acurx Data: Preloaded financials – from revenue to EBIT – based on actual and projected figures for Acurx Pharmaceuticals, Inc. (ACXP).
- Full Customization: Adjust all critical parameters (yellow cells) like WACC, growth %, and tax rates specific to Acurx Pharmaceuticals, Inc. (ACXP).
- Instant Valuation Updates: Automatic recalculations to analyze the impact of changes on Acurx Pharmaceuticals, Inc. (ACXP)’s fair value.
- Versatile Excel Template: Tailored for quick edits, scenario testing, and detailed projections for Acurx Pharmaceuticals, Inc. (ACXP).
- Time-Saving and Accurate: Skip building models from scratch while maintaining precision and flexibility for Acurx Pharmaceuticals, Inc. (ACXP).
Key Features
- Comprehensive ACXP Data: Pre-filled with Acurx Pharmaceuticals’ historical financials and future projections.
- Customizable Input Options: Modify revenue growth, profit margins, WACC, tax rates, and capital expenditures as needed.
- Dynamic Valuation Framework: Automatic recalculations of Net Present Value (NPV) and intrinsic value based on your adjustments.
- Scenario Analysis: Develop various forecast scenarios to evaluate different valuation results.
- User-Centric Interface: Intuitive, organized, and tailored for both professionals and newcomers.
How It Works
- 1. Access the Template: Download and open the Excel file containing Acurx Pharmaceuticals, Inc. (ACXP) preloaded data.
- 2. Modify Assumptions: Adjust key inputs such as growth rates, WACC, and capital expenditures as needed.
- 3. View Results Instantly: The DCF model automatically calculates intrinsic value and NPV based on your inputs.
- 4. Explore Scenarios: Evaluate various forecasts to assess different valuation outcomes effectively.
- 5. Utilize with Assurance: Present well-founded valuation insights to inform your strategic decisions.
Why Choose Acurx Pharmaceuticals Calculator?
- User-Friendly Interface: Suitable for both novice and experienced users.
- Customizable Inputs: Easily adjust parameters to suit your evaluation needs.
- Real-Time Feedback: Watch Acurx’s valuation update instantly as you make changes.
- Preloaded Data: Comes equipped with Acurx’s latest financial metrics for efficient analysis.
- Preferred by Analysts: Valued by investors and analysts for making well-informed choices.
Who Should Use Acurx Pharmaceuticals, Inc. (ACXP)?
- Investors: Gain insights into the pharmaceutical sector with a reliable analysis tool.
- Financial Analysts: Streamline your workflow with an intuitive model designed for drug development evaluations.
- Consultants: Easily modify the framework for client-facing presentations or strategic reports.
- Pharmaceutical Enthusiasts: Enhance your knowledge of drug valuation methodologies through practical examples.
- Educators and Students: Utilize it as a hands-on resource in pharmaceutical finance courses.
What the Template Contains
- Historical Data: Includes Acurx Pharmaceuticals' past financials and baseline forecasts.
- DCF and Levered DCF Models: Detailed templates to calculate Acurx Pharmaceuticals' intrinsic value.
- WACC Sheet: Pre-built calculations for Weighted Average Cost of Capital.
- Editable Inputs: Modify key drivers like growth rates, EBITDA %, and CAPEX assumptions.
- Quarterly and Annual Statements: A complete breakdown of Acurx Pharmaceuticals' financials.
- Interactive Dashboard: Visualize valuation results and projections dynamically.
Disclaimer
All information, articles, and product details provided on this website are for general informational and educational purposes only. We do not claim any ownership over, nor do we intend to infringe upon, any trademarks, copyrights, logos, brand names, or other intellectual property mentioned or depicted on this site. Such intellectual property remains the property of its respective owners, and any references here are made solely for identification or informational purposes, without implying any affiliation, endorsement, or partnership.
We make no representations or warranties, express or implied, regarding the accuracy, completeness, or suitability of any content or products presented. Nothing on this website should be construed as legal, tax, investment, financial, medical, or other professional advice. In addition, no part of this site—including articles or product references—constitutes a solicitation, recommendation, endorsement, advertisement, or offer to buy or sell any securities, franchises, or other financial instruments, particularly in jurisdictions where such activity would be unlawful.
All content is of a general nature and may not address the specific circumstances of any individual or entity. It is not a substitute for professional advice or services. Any actions you take based on the information provided here are strictly at your own risk. You accept full responsibility for any decisions or outcomes arising from your use of this website and agree to release us from any liability in connection with your use of, or reliance upon, the content or products found herein.