
|
Adani Green Energy Limited (ADANIGREEN.NS) DCF Valuation |
Fully Editable: Tailor To Your Needs In Excel Or Sheets
Professional Design: Trusted, Industry-Standard Templates
Investor-Approved Valuation Models
MAC/PC Compatible, Fully Unlocked
No Expertise Is Needed; Easy To Follow
Adani Green Energy Limited (ADANIGREEN.NS) Bundle
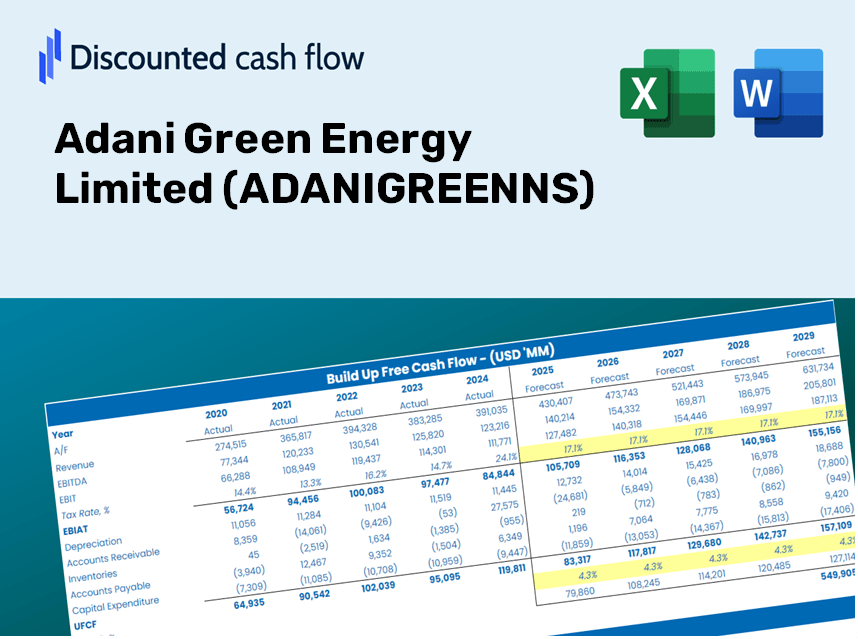
Designed for accuracy, our (ADANIGREENNS) DCF Calculator enables you to evaluate Adani Green Energy Limited’s valuation using real-world financial data, offering complete flexibility to modify all essential parameters for improved projections.
Discounted Cash Flow (DCF) - (USD MM)
| Year | AY1 2021 |
AY2 2022 |
AY3 2023 |
AY4 2024 |
AY5 2025 |
FY1 2026 |
FY2 2027 |
FY3 2028 |
FY4 2029 |
FY5 2030 |
|---|---|---|---|---|---|---|---|---|---|---|
| Revenue | 31,290.0 | 51,430.0 | 77,910.0 | 92,440.0 | 113,510.0 | 158,146.7 | 220,336.2 | 306,981.2 | 427,698.5 | 595,886.6 |
| Revenue Growth, % | 0 | 64.37 | 51.49 | 18.65 | 22.79 | 39.32 | 39.32 | 39.32 | 39.32 | 39.32 |
| EBITDA | 22,440.0 | 34,940.0 | 54,360.0 | 72,750.0 | 89,560.0 | 116,088.0 | 161,738.4 | 225,340.3 | 313,953.2 | 437,412.1 |
| EBITDA, % | 71.72 | 67.94 | 69.77 | 78.7 | 78.9 | 73.41 | 73.41 | 73.41 | 73.41 | 73.41 |
| Depreciation | 4,770.0 | 8,180.0 | 11,910.0 | 18,100.0 | 24,100.0 | 27,596.1 | 38,447.9 | 53,567.2 | 74,632.0 | 103,980.2 |
| Depreciation, % | 15.24 | 15.91 | 15.29 | 19.58 | 21.23 | 17.45 | 17.45 | 17.45 | 17.45 | 17.45 |
| EBIT | 17,670.0 | 26,760.0 | 42,450.0 | 54,650.0 | 65,460.0 | 88,491.9 | 123,290.4 | 171,773.1 | 239,321.2 | 333,431.8 |
| EBIT, % | 56.47 | 52.03 | 54.49 | 59.12 | 57.67 | 55.96 | 55.96 | 55.96 | 55.96 | 55.96 |
| Total Cash | 6,700.0 | 14,830.0 | 26,450.0 | 41,440.0 | 45,870.0 | 53,591.8 | 74,666.2 | 104,027.9 | 144,935.9 | 201,930.4 |
| Total Cash, percent | .0 | .0 | .0 | .0 | .0 | .0 | .0 | .0 | .0 | .0 |
| Account Receivables | 17,760.0 | 21,720.0 | 25,180.0 | 16,960.0 | 17,110.0 | 52,103.5 | 72,592.6 | 101,138.9 | 140,910.8 | 196,322.5 |
| Account Receivables, % | 56.76 | 42.23 | 32.32 | 18.35 | 15.07 | 32.95 | 32.95 | 32.95 | 32.95 | 32.95 |
| Inventories | 290.0 | 2,910.0 | 1,220.0 | 3,780.0 | 1,010.0 | 4,152.9 | 5,786.0 | 8,061.2 | 11,231.2 | 15,647.8 |
| Inventories, % | 0.92681 | 5.66 | 1.57 | 4.09 | 0.88979 | 2.63 | 2.63 | 2.63 | 2.63 | 2.63 |
| Accounts Payable | 2,380.0 | 2,350.0 | 5,690.0 | 5,420.0 | 3,950.0 | 9,116.2 | 12,701.1 | 17,695.6 | 24,654.3 | 34,349.3 |
| Accounts Payable, % | 7.61 | 4.57 | 7.3 | 5.86 | 3.48 | 5.76 | 5.76 | 5.76 | 5.76 | 5.76 |
| Capital Expenditure | -61,430.0 | -147,920.0 | -33,760.0 | -157,730.0 | -247,760.0 | -140,223.0 | -195,364.2 | -272,189.2 | -379,224.9 | -528,351.3 |
| Capital Expenditure, % | -196.32 | -287.61 | -43.33 | -170.63 | -218.27 | -88.67 | -88.67 | -88.67 | -88.67 | -88.67 |
| Tax Rate, % | 34.81 | 34.81 | 34.81 | 34.81 | 34.81 | 34.81 | 34.81 | 34.81 | 34.81 | 34.81 |
| EBITAT | 19,226.4 | 23,663.0 | 28,994.6 | 35,975.5 | 42,674.6 | 68,625.5 | 95,611.8 | 133,210.2 | 185,593.8 | 258,576.7 |
| Depreciation | ||||||||||
| Changes in Account Receivables | ||||||||||
| Changes in Inventories | ||||||||||
| Changes in Accounts Payable | ||||||||||
| Capital Expenditure | ||||||||||
| UFCF | -53,103.6 | -122,687.0 | 8,714.6 | -98,264.5 | -179,835.4 | -76,971.5 | -79,841.8 | -111,238.8 | -154,982.4 | -215,927.6 |
| WACC, % | 7.07 | 6.84 | 6.44 | 6.39 | 6.38 | 6.63 | 6.63 | 6.63 | 6.63 | 6.63 |
| PV UFCF | ||||||||||
| SUM PV UFCF | -510,762.2 | |||||||||
| Long Term Growth Rate, % | 2.00 | |||||||||
| Free cash flow (T + 1) | -220,246 | |||||||||
| Terminal Value | -4,761,591 | |||||||||
| Present Terminal Value | -3,454,993 | |||||||||
| Enterprise Value | -3,965,756 | |||||||||
| Net Debt | 778,280 | |||||||||
| Equity Value | -4,744,036 | |||||||||
| Diluted Shares Outstanding, MM | 1,584 | |||||||||
| Equity Value Per Share | -2,994.91 |
What You Will Receive
- Genuine ADANIGREENNS Financial Data: Pre-filled with Adani Green Energy Limited’s historical and projected data for accurate analysis.
- Completely Customizable Template: Easily adjust key parameters such as revenue growth, WACC, and EBITDA percentages.
- Instant Calculations: Observe immediate updates to Adani Green Energy’s intrinsic value as you modify inputs.
- Professional Valuation Tool: Tailored for investors, analysts, and consultants aiming for precise DCF outcomes.
- Intuitive Design: Clear structure and straightforward instructions suitable for all skill levels.
Key Features
- Advanced DCF Calculator: Comprehensive unlevered and levered DCF valuation models tailored for Adani Green Energy Limited (ADANIGREENNS).
- WACC Calculator: Pre-configured Weighted Average Cost of Capital sheet with adjustable parameters specific to Adani Green Energy.
- Editable Forecast Assumptions: Easily modify growth expectations, capital expenditures, and discount rates to suit your analysis of Adani Green Energy Limited (ADANIGREENNS).
- Integrated Financial Ratios: Assess profitability, leverage, and efficiency ratios for Adani Green Energy Limited (ADANIGREENNS).
- Dashboard and Charts: Visual representations that encapsulate essential valuation metrics for straightforward analysis of Adani Green Energy Limited (ADANIGREENNS).
How It Functions
- Step 1: Download the preconfigured Excel template containing Adani Green Energy Limited’s (ADANIGREENNS) data.
- Step 2: Review the pre-filled sheets to familiarize yourself with the essential metrics.
- Step 3: Modify forecasts and assumptions in the editable yellow cells (WACC, growth, margins).
- Step 4: Immediately see updated results, including Adani Green Energy Limited’s (ADANIGREENNS) intrinsic value.
- Step 5: Make well-informed investment choices or create reports using the generated outputs.
Why Choose This Calculator for Adani Green Energy Limited (ADANIGREENNS)?
- Precise Data: Access to actual Adani Green financials guarantees trustworthy valuation outcomes.
- Flexible: Tailor essential parameters such as growth rates, WACC, and tax rates to align with your forecasts.
- Efficiency Booster: Pre-configured calculations save you the effort of starting from the ground up.
- Professional-Quality Tool: Specifically designed for investors, analysts, and consultants in the renewable energy sector.
- User-Friendly Experience: An intuitive interface and guided instructions make it accessible for everyone.
Who Can Benefit from This Product?
- Professional Investors: Develop comprehensive and accurate valuation models for analyzing investment portfolios involving Adani Green Energy Limited (ADANIGREENNS).
- Corporate Finance Teams: Evaluate valuation scenarios to inform strategic planning within their organizations.
- Consultants and Advisors: Deliver precise valuation insights and recommendations to clients regarding Adani Green Energy Limited (ADANIGREENNS).
- Students and Educators: Utilize real-time data to enhance learning and practical application of financial modeling techniques.
- Energy Sector Enthusiasts: Gain a deeper understanding of how renewable energy companies like Adani Green Energy Limited (ADANIGREENNS) are valued in the market.
Contents of the Template
- Operating and Balance Sheet Data: Pre-filled historical data and forecasts for Adani Green Energy Limited (ADANIGREENNS), including revenue, EBITDA, EBIT, and capital expenditures.
- WACC Calculation: A dedicated worksheet for calculating the Weighted Average Cost of Capital (WACC), featuring parameters like Beta, risk-free rate, and share price.
- DCF Valuation (Unlevered and Levered): Customizable Discounted Cash Flow models displaying intrinsic values with comprehensive calculations.
- Financial Statements: Pre-populated annual and quarterly financial statements to facilitate analysis.
- Key Ratios: Includes essential profitability, leverage, and efficiency ratios for Adani Green Energy Limited (ADANIGREENNS).
- Dashboard and Charts: A visual overview of valuation outputs and assumptions, making it easier to analyze results.
Disclaimer
All information, articles, and product details provided on this website are for general informational and educational purposes only. We do not claim any ownership over, nor do we intend to infringe upon, any trademarks, copyrights, logos, brand names, or other intellectual property mentioned or depicted on this site. Such intellectual property remains the property of its respective owners, and any references here are made solely for identification or informational purposes, without implying any affiliation, endorsement, or partnership.
We make no representations or warranties, express or implied, regarding the accuracy, completeness, or suitability of any content or products presented. Nothing on this website should be construed as legal, tax, investment, financial, medical, or other professional advice. In addition, no part of this site—including articles or product references—constitutes a solicitation, recommendation, endorsement, advertisement, or offer to buy or sell any securities, franchises, or other financial instruments, particularly in jurisdictions where such activity would be unlawful.
All content is of a general nature and may not address the specific circumstances of any individual or entity. It is not a substitute for professional advice or services. Any actions you take based on the information provided here are strictly at your own risk. You accept full responsibility for any decisions or outcomes arising from your use of this website and agree to release us from any liability in connection with your use of, or reliance upon, the content or products found herein.