
|
Adani Power Limited (ADANIPOWER.NS) DCF Valuation |
Fully Editable: Tailor To Your Needs In Excel Or Sheets
Professional Design: Trusted, Industry-Standard Templates
Investor-Approved Valuation Models
MAC/PC Compatible, Fully Unlocked
No Expertise Is Needed; Easy To Follow
Adani Power Limited (ADANIPOWER.NS) Bundle
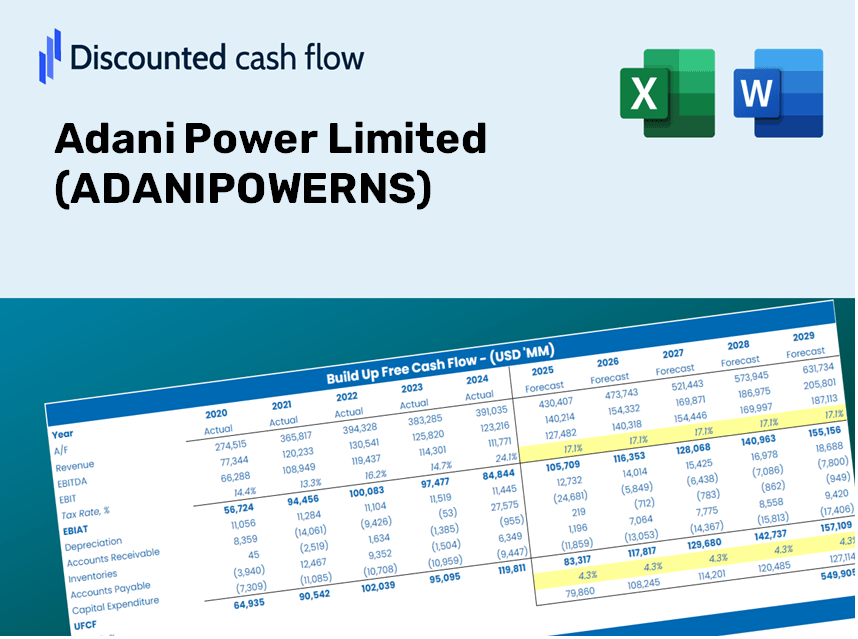
As an investor or analyst, this (ADANIPOWERNS) DCF Calculator serves as your essential tool for accurate valuation. Loaded with real data from Adani Power Limited, you can adjust forecasts and observe the effects in real-time.
Discounted Cash Flow (DCF) - (USD MM)
| Year | AY1 2021 |
AY2 2022 |
AY3 2023 |
AY4 2024 |
AY5 2025 |
FY1 2026 |
FY2 2027 |
FY3 2028 |
FY4 2029 |
FY5 2030 |
|---|---|---|---|---|---|---|---|---|---|---|
| Revenue | 262,214.8 | 277,111.8 | 387,733.0 | 503,512.5 | 562,030.9 | 684,389.6 | 833,386.7 | 1,014,821.7 | 1,235,756.5 | 1,504,790.6 |
| Revenue Growth, % | 0 | 5.68 | 39.92 | 29.86 | 11.62 | 21.77 | 21.77 | 21.77 | 21.77 | 21.77 |
| EBITDA | 86,764.0 | 99,187.4 | 102,030.7 | 182,160.8 | 213,884.7 | 231,913.0 | 282,402.3 | 343,883.6 | 418,749.8 | 509,915.0 |
| EBITDA, % | 33.09 | 35.79 | 26.31 | 36.18 | 38.06 | 33.89 | 33.89 | 33.89 | 33.89 | 33.89 |
| Depreciation | 31,728.4 | 30,902.9 | 32,749.1 | 38,935.5 | 42,410.2 | 64,301.0 | 78,299.8 | 95,346.4 | 116,104.0 | 141,380.8 |
| Depreciation, % | 12.1 | 11.15 | 8.45 | 7.73 | 7.55 | 9.4 | 9.4 | 9.4 | 9.4 | 9.4 |
| EBIT | 55,035.6 | 68,284.5 | 69,281.6 | 143,225.3 | 171,474.5 | 167,612.0 | 204,102.5 | 248,537.2 | 302,645.8 | 368,534.2 |
| EBIT, % | 20.99 | 24.64 | 17.87 | 28.45 | 30.51 | 24.49 | 24.49 | 24.49 | 24.49 | 24.49 |
| Total Cash | 1,337.4 | 9,700.5 | 9,607.7 | 33,481.2 | 71,575.8 | 35,414.8 | 43,124.9 | 52,513.5 | 63,946.1 | 77,867.7 |
| Total Cash, percent | .0 | .0 | .0 | .0 | .0 | .0 | .0 | .0 | .0 | .0 |
| Account Receivables | 120,205.9 | 96,283.0 | 115,794.7 | 117,757.4 | 136,297.7 | 216,390.8 | 263,500.8 | 320,867.1 | 390,722.4 | 475,785.8 |
| Account Receivables, % | 45.84 | 34.75 | 29.86 | 23.39 | 24.25 | 31.62 | 31.62 | 31.62 | 31.62 | 31.62 |
| Inventories | 28,438.1 | 36,158.7 | 47,670.5 | 56,092.8 | 33,172.8 | 72,861.5 | 88,724.1 | 108,040.0 | 131,561.2 | 160,203.1 |
| Inventories, % | 10.85 | 13.05 | 12.29 | 11.14 | 5.9 | 10.65 | 10.65 | 10.65 | 10.65 | 10.65 |
| Accounts Payable | 38,031.3 | 35,082.1 | 30,794.5 | 36,363.0 | 29,776.6 | 65,189.3 | 79,381.5 | 96,663.5 | 117,708.0 | 143,333.9 |
| Accounts Payable, % | 14.5 | 12.66 | 7.94 | 7.22 | 5.3 | 9.53 | 9.53 | 9.53 | 9.53 | 9.53 |
| Capital Expenditure | -40,296.1 | -34,345.5 | -32,436.8 | -26,024.5 | -115,590.4 | -84,676.2 | -103,110.9 | -125,559.0 | -152,894.2 | -186,180.5 |
| Capital Expenditure, % | -15.37 | -12.39 | -8.37 | -5.17 | -20.57 | -12.37 | -12.37 | -12.37 | -12.37 | -12.37 |
| Tax Rate, % | 20.91 | 20.91 | 20.91 | 20.91 | 20.91 | 20.91 | 20.91 | 20.91 | 20.91 | 20.91 |
| EBITAT | 30,538.2 | 50,992.6 | 96,832.3 | 143,482.1 | 135,619.5 | 137,192.1 | 167,059.9 | 203,430.2 | 247,718.6 | 301,649.0 |
| Depreciation | ||||||||||
| Changes in Account Receivables | ||||||||||
| Changes in Inventories | ||||||||||
| Changes in Accounts Payable | ||||||||||
| Capital Expenditure | ||||||||||
| UFCF | -88,642.2 | 60,803.1 | 61,833.5 | 151,576.6 | 60,232.6 | 32,447.8 | 93,468.5 | 113,817.4 | 138,596.4 | 168,769.9 |
| WACC, % | 5.22 | 5.4 | 5.64 | 5.64 | 5.44 | 5.47 | 5.47 | 5.47 | 5.47 | 5.47 |
| PV UFCF | ||||||||||
| SUM PV UFCF | 453,105.3 | |||||||||
| Long Term Growth Rate, % | 4.00 | |||||||||
| Free cash flow (T + 1) | 175,521 | |||||||||
| Terminal Value | 11,931,750 | |||||||||
| Present Terminal Value | 9,141,933 | |||||||||
| Enterprise Value | 9,595,038 | |||||||||
| Net Debt | 391,750 | |||||||||
| Equity Value | 9,203,288 | |||||||||
| Diluted Shares Outstanding, MM | 19,724 | |||||||||
| Equity Value Per Share | 466.60 |
What You Will Receive
- Pre-Filled Financial Model: Adani Power Limited’s actual data facilitates accurate DCF valuation.
- Comprehensive Forecast Control: Modify revenue growth, profit margins, WACC, and other essential factors.
- Real-Time Calculations: Automatic updates allow you to view results instantly as you make adjustments.
- Investor-Ready Template: A polished Excel file crafted for high-quality valuation presentations.
- Customizable and Reusable: Designed for flexibility, making it suitable for repeated detailed forecasts.
Key Features
- Pre-Loaded Data: Adani Power Limited’s historical financial statements and pre-filled forecasts.
- Fully Adjustable Inputs: Modify WACC, tax rates, revenue growth, and EBITDA margins to suit your analysis.
- Instant Results: Observe Adani Power Limited’s intrinsic value recalculating in real time.
- Clear Visual Outputs: Dashboard charts present valuation results and essential metrics clearly.
- Built for Accuracy: A professional-grade tool designed for analysts, investors, and finance professionals.
How It Works
- Step 1: Download the Excel file for Adani Power Limited (ADANIPOWERNS).
- Step 2: Review the pre-filled financial data and forecasts provided for Adani Power Limited.
- Step 3: Adjust key variables such as revenue growth, WACC, and tax rates (highlighted cells).
- Step 4: Observe the DCF model refresh in real-time as you modify your assumptions.
- Step 5: Evaluate the outputs and leverage the results for your investment analysis.
Why Choose This Calculator for Adani Power Limited (ADANIPOWERNS)?
- Precision: Utilizes actual Adani Power financial data for reliable results.
- Versatility: Crafted to allow users to easily test and adjust various inputs.
- Efficiency: Eliminate the need to create a DCF model from the ground up.
- CFO-Grade Quality: Built with the accuracy and usability expected at the executive level.
- Intuitive Design: Simple to navigate, suitable for users with basic financial knowledge.
Who Can Benefit from This Product?
- Professional Investors: Create comprehensive and trustworthy valuation models for portfolio evaluations.
- Corporate Finance Departments: Assess valuation scenarios to inform strategic decision-making.
- Consultants and Advisors: Offer clients precise valuation insights for Adani Power Limited (ADANIPOWERNS) stock.
- Students and Educators: Utilize real-world data to practice and instruct on financial modeling techniques.
- Energy Sector Enthusiasts: Gain insights into how energy companies like Adani Power Limited (ADANIPOWERNS) are valued in the marketplace.
Contents of the Template
- Preloaded ADANIPOWERNS Data: Historical and projected financial metrics, including revenue, EBIT, and capital expenditures.
- DCF and WACC Models: Advanced sheets designed for calculating intrinsic value and the Weighted Average Cost of Capital.
- Editable Inputs: Cells highlighted in yellow for modifying revenue growth, tax rates, and discount rates.
- Financial Statements: Detailed annual and quarterly financial documents for in-depth analysis.
- Key Ratios: Ratios related to profitability, leverage, and efficiency to assess company performance.
- Dashboard and Charts: Visual representations of valuation results and key assumptions.
Disclaimer
All information, articles, and product details provided on this website are for general informational and educational purposes only. We do not claim any ownership over, nor do we intend to infringe upon, any trademarks, copyrights, logos, brand names, or other intellectual property mentioned or depicted on this site. Such intellectual property remains the property of its respective owners, and any references here are made solely for identification or informational purposes, without implying any affiliation, endorsement, or partnership.
We make no representations or warranties, express or implied, regarding the accuracy, completeness, or suitability of any content or products presented. Nothing on this website should be construed as legal, tax, investment, financial, medical, or other professional advice. In addition, no part of this site—including articles or product references—constitutes a solicitation, recommendation, endorsement, advertisement, or offer to buy or sell any securities, franchises, or other financial instruments, particularly in jurisdictions where such activity would be unlawful.
All content is of a general nature and may not address the specific circumstances of any individual or entity. It is not a substitute for professional advice or services. Any actions you take based on the information provided here are strictly at your own risk. You accept full responsibility for any decisions or outcomes arising from your use of this website and agree to release us from any liability in connection with your use of, or reliance upon, the content or products found herein.