
|
Alset EHome International Inc. (AEI) DCF Valuation |
Fully Editable: Tailor To Your Needs In Excel Or Sheets
Professional Design: Trusted, Industry-Standard Templates
Investor-Approved Valuation Models
MAC/PC Compatible, Fully Unlocked
No Expertise Is Needed; Easy To Follow
Alset EHome International Inc. (AEI) Bundle
Simplify Alset EHome International Inc. (AEI) valuation with this customizable DCF Calculator! Featuring real Alset EHome International Inc. (AEI) financials and adjustable forecast inputs, you can test scenarios and uncover Alset EHome International Inc. (AEI) fair value in minutes.
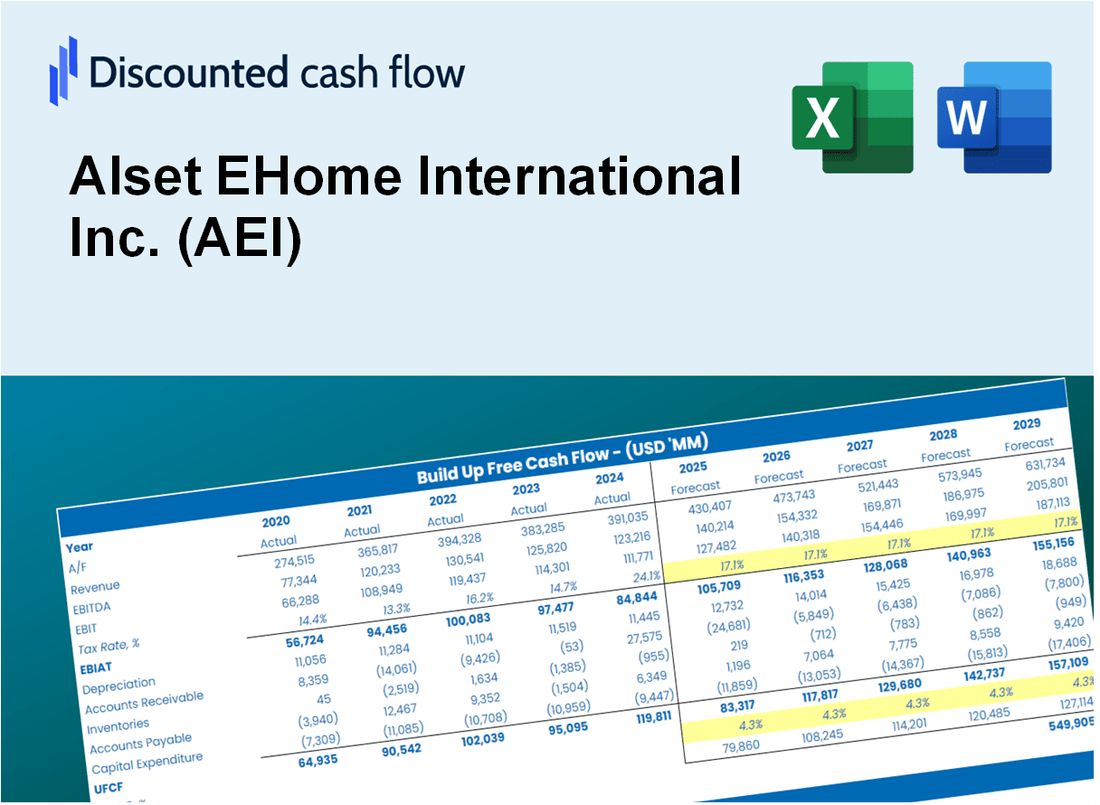
Discounted Cash Flow (DCF) - (USD MM)
| Year | AY1 2020 |
AY2 2021 |
AY3 2022 |
AY4 2023 |
AY5 2024 |
FY1 2025 |
FY2 2026 |
FY3 2027 |
FY4 2028 |
FY5 2029 |
|---|---|---|---|---|---|---|---|---|---|---|
| Revenue | 16.2 | 19.8 | 4.5 | 22.1 | 21.1 | 23.2 | 25.6 | 28.1 | 31.0 | 34.1 |
| Revenue Growth, % | 0 | 21.93 | -77.37 | 393 | -4.4 | 10.04 | 10.04 | 10.04 | 10.04 | 10.04 |
| EBITDA | -1.8 | -64.9 | -5.3 | -.8 | -2.7 | -10.6 | -11.6 | -12.8 | -14.1 | -15.5 |
| EBITDA, % | -11.25 | -327.61 | -118.13 | -3.62 | -12.67 | -45.51 | -45.51 | -45.51 | -45.51 | -45.51 |
| Depreciation | 18.4 | 34.8 | 11.6 | 1.2 | 1.2 | 14.5 | 15.9 | 17.5 | 19.3 | 21.2 |
| Depreciation, % | 113.45 | 175.73 | 258.23 | 5.51 | 5.82 | 62.27 | 62.27 | 62.27 | 62.27 | 62.27 |
| EBIT | -20.2 | -99.7 | -16.9 | -2.0 | -3.9 | -15.2 | -16.8 | -18.4 | -20.3 | -22.3 |
| EBIT, % | -124.7 | -503.34 | -376.36 | -9.13 | -18.48 | -65.52 | -65.52 | -65.52 | -65.52 | -65.52 |
| Total Cash | 71.3 | 123.3 | 90.4 | 48.5 | 48.6 | 23.2 | 25.6 | 28.1 | 31.0 | 34.1 |
| Total Cash, percent | .0 | .0 | .0 | .0 | .0 | .0 | .0 | .0 | .0 | .0 |
| Account Receivables | 1.4 | 13.2 | 4.1 | .1 | 9.8 | 9.9 | 10.9 | 12.0 | 13.2 | 14.5 |
| Account Receivables, % | 8.41 | 66.5 | 91.74 | 0.35094 | 46.36 | 42.67 | 42.67 | 42.67 | 42.67 | 42.67 |
| Inventories | .1 | .0 | .0 | .0 | .0 | .1 | .1 | .1 | .1 | .1 |
| Inventories, % | 0.55467 | 0.23885 | 0.78162 | 0.02517599 | 0.02326683 | 0.32472 | 0.32472 | 0.32472 | 0.32472 | 0.32472 |
| Accounts Payable | 1.7 | 11.3 | 3.0 | 4.3 | 3.6 | 7.9 | 8.7 | 9.6 | 10.6 | 11.6 |
| Accounts Payable, % | 10.29 | 57.29 | 66.59 | 19.67 | 17.08 | 34.18 | 34.18 | 34.18 | 34.18 | 34.18 |
| Capital Expenditure | .0 | -.2 | -.6 | .0 | -.1 | -.7 | -.8 | -.9 | -.9 | -1.0 |
| Capital Expenditure, % | -0.13348 | -1.15 | -13.38 | -0.13177 | -0.4866 | -3.06 | -3.06 | -3.06 | -3.06 | -3.06 |
| Tax Rate, % | 1.22 | 1.22 | 1.22 | 1.22 | 1.22 | 1.22 | 1.22 | 1.22 | 1.22 | 1.22 |
| EBITAT | -20.3 | -100.1 | -14.8 | -1.9 | -3.9 | -14.7 | -16.2 | -17.8 | -19.6 | -21.6 |
| Depreciation | ||||||||||
| Changes in Account Receivables | ||||||||||
| Changes in Inventories | ||||||||||
| Changes in Accounts Payable | ||||||||||
| Capital Expenditure | ||||||||||
| UFCF | -1.7 | -67.6 | -3.1 | 4.7 | -13.2 | 3.2 | -1.2 | -1.4 | -1.5 | -1.7 |
| WACC, % | 9.67 | 9.67 | 9.62 | 9.66 | 9.67 | 9.66 | 9.66 | 9.66 | 9.66 | 9.66 |
| PV UFCF | ||||||||||
| SUM PV UFCF | -1.2 | |||||||||
| Long Term Growth Rate, % | 2.00 | |||||||||
| Free cash flow (T + 1) | -2 | |||||||||
| Terminal Value | -22 | |||||||||
| Present Terminal Value | -14 | |||||||||
| Enterprise Value | -15 | |||||||||
| Net Debt | -24 | |||||||||
| Equity Value | 9 | |||||||||
| Diluted Shares Outstanding, MM | 9 | |||||||||
| Equity Value Per Share | 0.99 |
What You Will Get
- Pre-Filled Financial Model: Alset EHome International Inc.’s (AEI) actual data facilitates accurate DCF valuation.
- Full Forecast Control: Modify revenue growth, profit margins, WACC, and other essential factors.
- Instant Calculations: Real-time updates allow you to view results as you adjust variables.
- Investor-Ready Template: A polished Excel file crafted for high-quality valuation.
- Customizable and Reusable: Designed for adaptability, enabling repeated use for comprehensive forecasts.
Key Features
- Comprehensive AEI Data: Pre-filled with Alset EHome International Inc.'s historical performance and future forecasts.
- Customizable Financial Inputs: Modify revenue growth rates, profit margins, WACC, tax rates, and capital expenditures as needed.
- Interactive Valuation Model: Automatically refreshes Net Present Value (NPV) and intrinsic value in response to your adjustments.
- Scenario Analysis: Develop various forecasting scenarios to evaluate different valuation possibilities.
- Intuitive User Interface: Designed to be straightforward and accessible for both professionals and novices.
How It Works
- Download: Obtain the pre-prepared Excel file containing Alset EHome International Inc.'s (AEI) financial data.
- Customize: Modify forecasts such as revenue growth, EBITDA %, and WACC to fit your analysis.
- Update Automatically: Watch as intrinsic value and NPV calculations refresh in real-time.
- Test Scenarios: Generate various projections and evaluate outcomes immediately.
- Make Decisions: Leverage the valuation insights to inform your investment approach.
Why Choose This Calculator for Alset EHome International Inc. (AEI)?
- Accuracy: Utilizes real Alset EHome financial data to ensure precision.
- Flexibility: Built for users to easily adjust and test various inputs.
- Time-Saving: Eliminate the need to construct a DCF model from the ground up.
- Professional-Grade: Crafted with the expertise and usability expected at the CFO level.
- User-Friendly: Intuitive design makes it accessible for users without extensive financial modeling skills.
Who Should Use This Product?
- Individual Investors: Make informed decisions about buying or selling Alset EHome International Inc. (AEI) stock.
- Financial Analysts: Streamline valuation processes with ready-to-use financial models for Alset EHome International Inc. (AEI).
- Consultants: Deliver professional valuation insights on Alset EHome International Inc. (AEI) to clients quickly and accurately.
- Business Owners: Understand how companies like Alset EHome International Inc. (AEI) are valued to guide your own strategy.
- Finance Students: Learn valuation techniques using real-world data and scenarios related to Alset EHome International Inc. (AEI).
What the Template Contains
- Pre-Filled DCF Model: Alset EHome International Inc.’s (AEI) financial data preloaded for immediate use.
- WACC Calculator: Detailed calculations for Weighted Average Cost of Capital.
- Financial Ratios: Evaluate Alset EHome’s (AEI) profitability, leverage, and efficiency.
- Editable Inputs: Change assumptions such as growth, margins, and CAPEX to fit your scenarios.
- Financial Statements: Annual and quarterly reports to support detailed analysis.
- Interactive Dashboard: Easily visualize key valuation metrics and results.
Disclaimer
All information, articles, and product details provided on this website are for general informational and educational purposes only. We do not claim any ownership over, nor do we intend to infringe upon, any trademarks, copyrights, logos, brand names, or other intellectual property mentioned or depicted on this site. Such intellectual property remains the property of its respective owners, and any references here are made solely for identification or informational purposes, without implying any affiliation, endorsement, or partnership.
We make no representations or warranties, express or implied, regarding the accuracy, completeness, or suitability of any content or products presented. Nothing on this website should be construed as legal, tax, investment, financial, medical, or other professional advice. In addition, no part of this site—including articles or product references—constitutes a solicitation, recommendation, endorsement, advertisement, or offer to buy or sell any securities, franchises, or other financial instruments, particularly in jurisdictions where such activity would be unlawful.
All content is of a general nature and may not address the specific circumstances of any individual or entity. It is not a substitute for professional advice or services. Any actions you take based on the information provided here are strictly at your own risk. You accept full responsibility for any decisions or outcomes arising from your use of this website and agree to release us from any liability in connection with your use of, or reliance upon, the content or products found herein.