
|
Affle Limited (AFFLE.NS) DCF Valuation |
Fully Editable: Tailor To Your Needs In Excel Or Sheets
Professional Design: Trusted, Industry-Standard Templates
Investor-Approved Valuation Models
MAC/PC Compatible, Fully Unlocked
No Expertise Is Needed; Easy To Follow
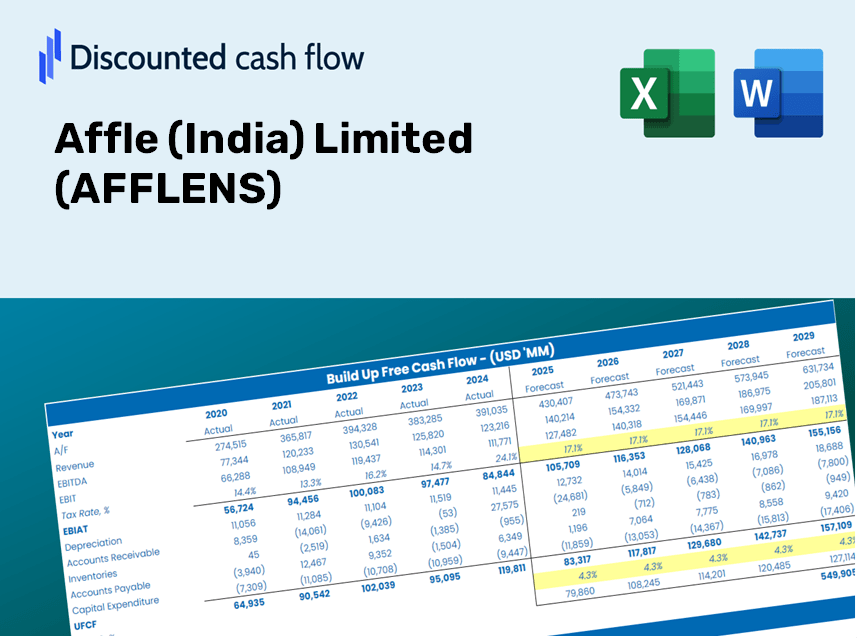
Affle (India) Limited (AFFLE.NS) Bundle
Streamline your process and boost precision with our (AFFLENS) DCF Calculator! Utilizing real Affle (India) Limited data and customizable assumptions, this tool empowers you to forecast, analyze, and value Affle like a seasoned investor.
Discounted Cash Flow (DCF) - (USD MM)
| Year | AY1 2021 |
AY2 2022 |
AY3 2023 |
AY4 2024 |
AY5 2025 |
FY1 2026 |
FY2 2027 |
FY3 2028 |
FY4 2029 |
FY5 2030 |
|---|---|---|---|---|---|---|---|---|---|---|
| Revenue | 5,167.8 | 10,816.6 | 14,339.6 | 18,428.1 | 22,663.1 | 33,091.7 | 48,319.2 | 70,553.7 | 103,019.7 | 150,425.2 |
| Revenue Growth, % | 0 | 109.31 | 32.57 | 28.51 | 22.98 | 46.02 | 46.02 | 46.02 | 46.02 | 46.02 |
| EBITDA | 1,711.5 | 2,844.3 | 3,427.3 | 4,169.5 | 5,769.3 | 8,696.4 | 12,698.1 | 18,541.3 | 27,073.2 | 39,531.2 |
| EBITDA, % | 33.12 | 26.3 | 23.9 | 22.63 | 25.46 | 26.28 | 26.28 | 26.28 | 26.28 | 26.28 |
| Depreciation | 196.4 | 324.4 | 494.2 | 715.3 | 967.0 | 1,217.3 | 1,777.5 | 2,595.4 | 3,789.7 | 5,533.5 |
| Depreciation, % | 3.8 | 3 | 3.45 | 3.88 | 4.27 | 3.68 | 3.68 | 3.68 | 3.68 | 3.68 |
| EBIT | 1,515.2 | 2,519.9 | 2,933.1 | 3,454.3 | 4,802.3 | 7,479.1 | 10,920.6 | 15,945.9 | 23,283.5 | 33,997.7 |
| EBIT, % | 29.32 | 23.3 | 20.45 | 18.74 | 21.19 | 22.6 | 22.6 | 22.6 | 22.6 | 22.6 |
| Total Cash | 632.5 | 6,046.2 | 7,795.4 | 13,703.8 | 15,437.6 | 17,537.3 | 25,607.3 | 37,390.7 | 54,596.4 | 79,719.4 |
| Total Cash, percent | .0 | .0 | .0 | .0 | .0 | .0 | .0 | .0 | .0 | .0 |
| Account Receivables | 1,605.6 | 3,105.0 | 3,546.8 | 5,226.3 | 5,539.2 | 9,087.8 | 13,269.6 | 19,375.8 | 28,291.8 | 41,310.5 |
| Account Receivables, % | 31.07 | 28.71 | 24.73 | 28.36 | 24.44 | 27.46 | 27.46 | 27.46 | 27.46 | 27.46 |
| Inventories | .0 | .0 | -1,445.9 | .0 | .0 | -667.3 | -974.4 | -1,422.8 | -2,077.5 | -3,033.5 |
| Inventories, % | 0 | 0 | -10.08 | 0 | 0 | -2.02 | -2.02 | -2.02 | -2.02 | -2.02 |
| Accounts Payable | 1,259.9 | 2,559.2 | 2,522.0 | 3,831.1 | 4,076.0 | 6,909.7 | 10,089.2 | 14,731.9 | 21,510.9 | 31,409.3 |
| Accounts Payable, % | 24.38 | 23.66 | 17.59 | 20.79 | 17.99 | 20.88 | 20.88 | 20.88 | 20.88 | 20.88 |
| Capital Expenditure | -492.8 | -725.4 | -921.7 | -1,156.3 | -1,599.0 | -2,382.7 | -3,479.1 | -5,080.0 | -7,417.6 | -10,830.9 |
| Capital Expenditure, % | -9.54 | -6.71 | -6.43 | -6.27 | -7.06 | -7.2 | -7.2 | -7.2 | -7.2 | -7.2 |
| Tax Rate, % | 18.34 | 18.34 | 18.34 | 18.34 | 18.34 | 18.34 | 18.34 | 18.34 | 18.34 | 18.34 |
| EBITAT | 1,380.8 | 2,201.6 | 2,548.0 | 3,142.2 | 3,921.5 | 6,551.6 | 9,566.4 | 13,968.5 | 20,396.3 | 29,781.8 |
| Depreciation | ||||||||||
| Changes in Account Receivables | ||||||||||
| Changes in Inventories | ||||||||||
| Changes in Accounts Payable | ||||||||||
| Capital Expenditure | ||||||||||
| UFCF | 738.6 | 1,600.6 | 3,087.3 | 884.8 | 3,221.5 | 5,338.7 | 7,169.6 | 10,468.8 | 15,286.1 | 22,320.2 |
| WACC, % | 6.47 | 6.47 | 6.47 | 6.47 | 6.47 | 6.47 | 6.47 | 6.47 | 6.47 | 6.47 |
| PV UFCF | ||||||||||
| SUM PV UFCF | 48,219.7 | |||||||||
| Long Term Growth Rate, % | 4.00 | |||||||||
| Free cash flow (T + 1) | 23,213 | |||||||||
| Terminal Value | 939,101 | |||||||||
| Present Terminal Value | 686,339 | |||||||||
| Enterprise Value | 734,558 | |||||||||
| Net Debt | -9,654 | |||||||||
| Equity Value | 744,212 | |||||||||
| Diluted Shares Outstanding, MM | 140 | |||||||||
| Equity Value Per Share | 5,298.97 |
What You Will Receive
- Customizable Excel Template: A fully editable Excel-based DCF Calculator featuring pre-filled financial data for Affle (India) Limited (AFFLENS).
- Accurate Data: Access to historical performance data and forward-looking projections (highlighted in the yellow cells).
- Adjustable Forecasts: Modify key assumptions such as revenue growth, EBITDA percentage, and WACC.
- Instant Calculations: Quickly observe how your inputs affect Affle's valuation.
- Professional Resource: Designed for investors, CFOs, consultants, and financial analysts.
- Easy-to-Use Interface: Organized for straightforward navigation, complete with step-by-step guidance.
Key Features
- Comprehensive DCF Calculator: Features detailed unlevered and levered DCF valuation frameworks.
- WACC Calculator: Ready-to-use Weighted Average Cost of Capital template with customizable parameters.
- Customizable Forecast Inputs: Adjust growth projections, capital expenditures, and discount rates as needed.
- Integrated Financial Ratios: Evaluate profitability, leverage, and efficiency ratios specific to Affle (India) Limited (AFFLENS).
- Visual Dashboard and Charts: Graphical representations highlight essential valuation metrics for quick analysis.
How It Works
- Step 1: Download the Excel file.
- Step 2: Review Affle (India) Limited's pre-filled financial data and projections.
- Step 3: Adjust key parameters such as revenue growth, WACC, and tax rates (highlighted cells).
- Step 4: Observe the DCF model update in real-time as you modify your assumptions.
- Step 5: Evaluate the results and leverage the insights for your investment strategies.
Why Choose This Calculator for Affle (India) Limited (AFFLENS)?
- Precision: Utilizes authentic Affle financial data for reliable results.
- Versatility: Tailored to allow users to easily adjust and experiment with inputs.
- Efficiency: Eliminate the tedious process of creating a DCF model from the ground up.
- High-Quality: Crafted with CFO-level expertise and practical functionality.
- Intuitive: Simple interface designed for users of all skill levels, including novices in financial modeling.
Who Can Benefit from This Product?
- Professional Investors: Create comprehensive and trustworthy valuation models for in-depth portfolio analysis of Affle (India) Limited (AFFLENS).
- Corporate Finance Teams: Evaluate valuation scenarios to inform and drive internal strategies for Affle (India) Limited (AFFLENS).
- Consultants and Advisors: Equip clients with precise valuation insights related to Affle (India) Limited (AFFLENS) stock.
- Students and Educators: Utilize real-world data to enhance financial modeling practices and education centered on Affle (India) Limited (AFFLENS).
- Tech Enthusiasts: Discover the valuation methods used for tech companies like Affle (India) Limited (AFFLENS) in the marketplace.
Contents of the Template
- Pre-Filled Data: Contains Affle (India) Limited’s historical financial information and projections.
- Discounted Cash Flow Model: An editable DCF valuation model with automatic computation features.
- Weighted Average Cost of Capital (WACC): A dedicated sheet for calculating WACC using personalized inputs.
- Key Financial Ratios: Evaluate Affle (India) Limited’s profitability, efficiency, and financial leverage.
- Customizable Inputs: Easily modify revenue growth rates, profit margins, and tax percentages.
- Intuitive Dashboard: Visual summaries with charts and tables presenting essential valuation results.
Disclaimer
All information, articles, and product details provided on this website are for general informational and educational purposes only. We do not claim any ownership over, nor do we intend to infringe upon, any trademarks, copyrights, logos, brand names, or other intellectual property mentioned or depicted on this site. Such intellectual property remains the property of its respective owners, and any references here are made solely for identification or informational purposes, without implying any affiliation, endorsement, or partnership.
We make no representations or warranties, express or implied, regarding the accuracy, completeness, or suitability of any content or products presented. Nothing on this website should be construed as legal, tax, investment, financial, medical, or other professional advice. In addition, no part of this site—including articles or product references—constitutes a solicitation, recommendation, endorsement, advertisement, or offer to buy or sell any securities, franchises, or other financial instruments, particularly in jurisdictions where such activity would be unlawful.
All content is of a general nature and may not address the specific circumstances of any individual or entity. It is not a substitute for professional advice or services. Any actions you take based on the information provided here are strictly at your own risk. You accept full responsibility for any decisions or outcomes arising from your use of this website and agree to release us from any liability in connection with your use of, or reliance upon, the content or products found herein.