
|
AGNC Investment Corp. (AGNC) DCF Valuation |
Fully Editable: Tailor To Your Needs In Excel Or Sheets
Professional Design: Trusted, Industry-Standard Templates
Investor-Approved Valuation Models
MAC/PC Compatible, Fully Unlocked
No Expertise Is Needed; Easy To Follow
AGNC Investment Corp. (AGNC) Bundle
Streamline your analysis and boost precision with our (AGNC) DCF Calculator! Utilizing authentic data from AGNC Investment Corp. and customizable assumptions, this tool empowers you to forecast, analyze, and value AGNC like a seasoned investor.
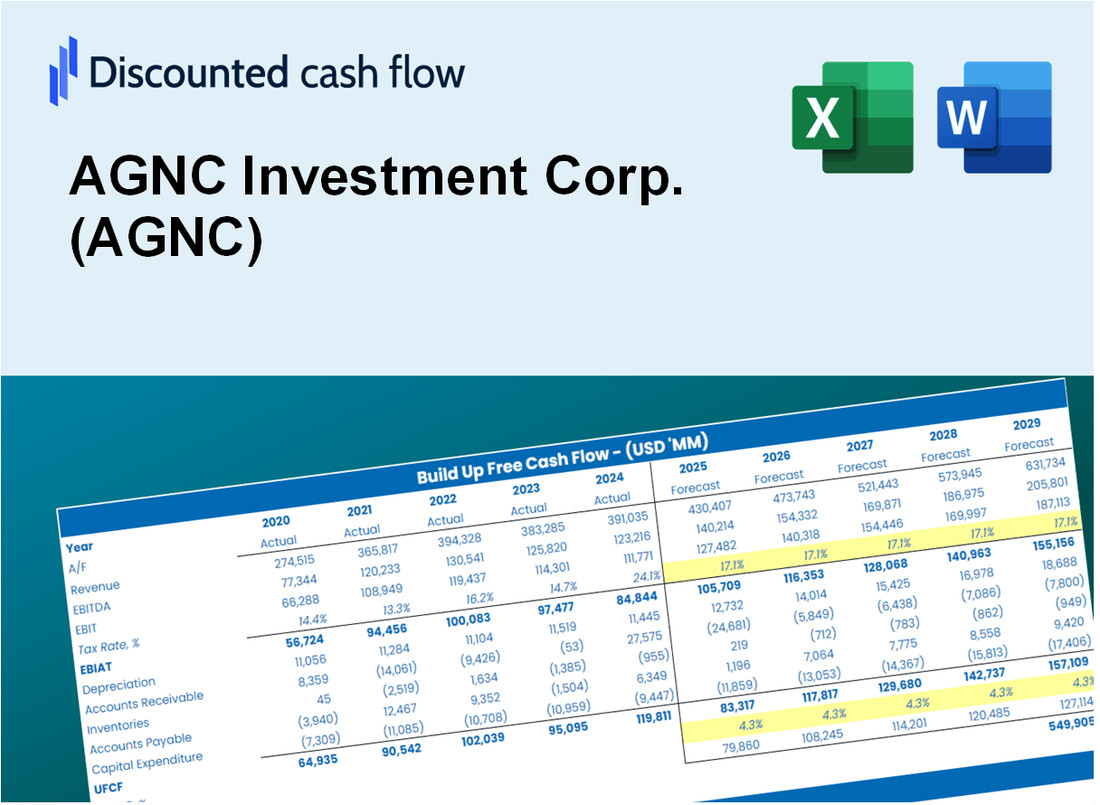
Discounted Cash Flow (DCF) - (USD MM)
| Year | AY1 2020 |
AY2 2021 |
AY3 2022 |
AY4 2023 |
AY5 2024 |
FY1 2025 |
FY2 2026 |
FY3 2027 |
FY4 2028 |
FY5 2029 |
|---|---|---|---|---|---|---|---|---|---|---|
| Revenue | -173.0 | 837.0 | -1,116.0 | 251.0 | 973.0 | 486.5 | 243.3 | 121.6 | 60.8 | 30.4 |
| Revenue Growth, % | 0 | -583.82 | -233.33 | -122.49 | 287.65 | -50 | -50 | -50 | -50 | -50 |
| EBITDA | 554.0 | 824.0 | 2,401.0 | 2,588.0 | 3,917.0 | 95.8 | 47.9 | 23.9 | 12.0 | 6.0 |
| EBITDA, % | -320.23 | 98.45 | -215.14 | 1031.08 | 402.57 | 19.69 | 19.69 | 19.69 | 19.69 | 19.69 |
| Depreciation | .0 | 1,590.0 | 3,869.0 | 2,529.0 | 123.0 | 109.6 | 54.8 | 27.4 | 13.7 | 6.9 |
| Depreciation, % | 0 | 189.96 | -346.68 | 1007.57 | 12.64 | 22.53 | 22.53 | 22.53 | 22.53 | 22.53 |
| EBIT | 554.0 | -766.0 | -1,468.0 | 59.0 | 3,794.0 | 31.1 | 15.6 | 7.8 | 3.9 | 1.9 |
| EBIT, % | -320.23 | -91.52 | 131.54 | 23.51 | 389.93 | 6.4 | 6.4 | 6.4 | 6.4 | 6.4 |
| Total Cash | 1,017.0 | 998.0 | 1,018.0 | 518.0 | 505.0 | 59.0 | 29.5 | 14.8 | 7.4 | 3.7 |
| Total Cash, percent | .0 | .0 | .0 | .0 | .0 | .0 | .0 | .0 | .0 | .0 |
| Account Receivables | 210.0 | 10,475.0 | 120.0 | 11,618.0 | 17,137.0 | 184.1 | 92.1 | 46.0 | 23.0 | 11.5 |
| Account Receivables, % | -121.39 | 1251.49 | -10.75 | 4628.69 | 1761.25 | 37.85 | 37.85 | 37.85 | 37.85 | 37.85 |
| Inventories | .0 | 1,525.0 | 9,076.0 | 1,771.0 | .0 | 97.3 | 48.6 | 24.3 | 12.2 | 6.1 |
| Inventories, % | 0 | 182.2 | -813.26 | 705.58 | 0 | 20 | 20 | 20 | 20 | 20 |
| Accounts Payable | 219.0 | 400.0 | 302.0 | .0 | .0 | -77.1 | -38.6 | -19.3 | -9.6 | -4.8 |
| Accounts Payable, % | -126.59 | 47.79 | -27.06 | 0 | 0 | -15.85 | -15.85 | -15.85 | -15.85 | -15.85 |
| Capital Expenditure | .0 | .0 | .0 | .0 | .0 | .0 | .0 | .0 | .0 | .0 |
| Capital Expenditure, % | 0 | 0 | 0 | 0 | 0 | 0 | 0 | 0 | 0 | 0 |
| Tax Rate, % | 0 | 0 | 0 | 0 | 0 | 0 | 0 | 0 | 0 | 0 |
| EBITAT | 554.0 | -766.0 | -1,468.0 | 59.0 | 3,794.0 | 31.1 | 15.6 | 7.8 | 3.9 | 1.9 |
| Depreciation | ||||||||||
| Changes in Account Receivables | ||||||||||
| Changes in Inventories | ||||||||||
| Changes in Accounts Payable | ||||||||||
| Capital Expenditure | ||||||||||
| UFCF | 563.0 | -10,785.0 | 5,107.0 | -1,907.0 | 169.0 | 16,919.2 | 249.6 | 124.8 | 62.4 | 31.2 |
| WACC, % | 46.72 | 46.72 | 46.72 | 46.72 | 46.72 | 46.72 | 46.72 | 46.72 | 46.72 | 46.72 |
| PV UFCF | ||||||||||
| SUM PV UFCF | 11,705.5 | |||||||||
| Long Term Growth Rate, % | 2.00 | |||||||||
| Free cash flow (T + 1) | 32 | |||||||||
| Terminal Value | 71 | |||||||||
| Present Terminal Value | 10 | |||||||||
| Enterprise Value | 11,716 | |||||||||
| Net Debt | -441 | |||||||||
| Equity Value | 12,157 | |||||||||
| Diluted Shares Outstanding, MM | 786 | |||||||||
| Equity Value Per Share | 15.47 |
What You Will Receive
- Customizable Excel Template: A fully adjustable Excel-based DCF Calculator featuring pre-filled real AGNC financials.
- Actual Data: Historical figures and forward-looking projections (highlighted in the yellow cells).
- Forecast Adaptability: Modify forecast parameters such as dividend yield, book value, and cost of equity.
- Instant Calculations: Quickly observe how your inputs affect AGNC's valuation.
- Professional Resource: Designed for investors, CFOs, consultants, and financial analysts.
- Intuitive Layout: Organized for clarity and simplicity, complete with step-by-step guidance.
Key Features
- Comprehensive Data: AGNC’s historical financials and pre-populated projections.
- Customizable Parameters: Adjust WACC, tax rates, dividend yields, and net interest margins.
- Real-Time Evaluation: Monitor AGNC’s intrinsic value updates instantly.
- Visual Analytics: Interactive dashboard charts illustrate valuation outcomes and essential metrics.
- Designed for Precision: A robust tool tailored for analysts, investors, and finance professionals.
How It Works
- Download: Obtain the pre-built Excel file featuring AGNC Investment Corp.'s (AGNC) financial data.
- Customize: Modify forecasts, such as dividend yield, net interest margin, and leverage ratios.
- Update Automatically: The intrinsic value and NPV calculations refresh in real-time.
- Test Scenarios: Develop various projections and evaluate results instantly.
- Make Decisions: Leverage the valuation insights to inform your investment approach.
Why Choose This Calculator for AGNC Investment Corp. (AGNC)?
- Designed for Investors: A sophisticated tool tailored for portfolio managers, analysts, and individual investors.
- Comprehensive Data: AGNC’s historical and projected financials are integrated for precise analysis.
- Flexible Scenario Analysis: Easily test various investment forecasts and assumptions.
- Insightful Outputs: Automatically computes intrinsic value, NPV, and other essential metrics.
- User-Friendly: Step-by-step guidance ensures a smooth experience for all users.
Who Should Use This Product?
- Institutional Investors: Develop comprehensive and accurate valuation models for AGNC's portfolio analysis.
- Real Estate Investment Teams: Evaluate valuation scenarios to inform strategic decisions regarding AGNC.
- Financial Advisors: Deliver precise valuation insights for clients interested in AGNC Investment Corp. (AGNC).
- Academic Students and Instructors: Utilize real market data to practice and teach financial modeling techniques related to AGNC.
- Market Analysts: Gain insights into how mortgage REITs like AGNC are assessed in the financial landscape.
What the Template Contains
- Pre-Filled DCF Model: AGNC Investment Corp.'s (AGNC) financial data preloaded for immediate use.
- WACC Calculator: Detailed calculations for Weighted Average Cost of Capital specific to AGNC.
- Financial Ratios: Assess AGNC’s profitability, leverage, and efficiency metrics.
- Editable Inputs: Modify assumptions such as growth rates, margins, and CAPEX to suit your analysis.
- Financial Statements: Access annual and quarterly reports for comprehensive evaluation.
- Interactive Dashboard: Easily visualize key valuation metrics and outcomes for AGNC.
Disclaimer
All information, articles, and product details provided on this website are for general informational and educational purposes only. We do not claim any ownership over, nor do we intend to infringe upon, any trademarks, copyrights, logos, brand names, or other intellectual property mentioned or depicted on this site. Such intellectual property remains the property of its respective owners, and any references here are made solely for identification or informational purposes, without implying any affiliation, endorsement, or partnership.
We make no representations or warranties, express or implied, regarding the accuracy, completeness, or suitability of any content or products presented. Nothing on this website should be construed as legal, tax, investment, financial, medical, or other professional advice. In addition, no part of this site—including articles or product references—constitutes a solicitation, recommendation, endorsement, advertisement, or offer to buy or sell any securities, franchises, or other financial instruments, particularly in jurisdictions where such activity would be unlawful.
All content is of a general nature and may not address the specific circumstances of any individual or entity. It is not a substitute for professional advice or services. Any actions you take based on the information provided here are strictly at your own risk. You accept full responsibility for any decisions or outcomes arising from your use of this website and agree to release us from any liability in connection with your use of, or reliance upon, the content or products found herein.