
|
Ashtead Group plc (AHT.L) DCF Valuation |
Fully Editable: Tailor To Your Needs In Excel Or Sheets
Professional Design: Trusted, Industry-Standard Templates
Investor-Approved Valuation Models
MAC/PC Compatible, Fully Unlocked
No Expertise Is Needed; Easy To Follow
Ashtead Group plc (AHT.L) Bundle
Streamline your analysis and boost precision with our (AHTL) DCF Calculator! Utilizing real data from Ashtead Group plc and customizable assumptions, this tool empowers you to forecast, evaluate, and value (AHTL) like a seasoned investor.
What You Will Receive
- Authentic AHTL Financials: Features historical and projected data for precise valuation.
- Customizable Inputs: Adjust WACC, tax rates, revenue growth, and capital expenditures to fit your analysis.
- Real-Time Calculations: Dynamic computation of intrinsic value and NPV.
- Scenario Simulation: Explore various scenarios to assess Ashtead Group's future performance.
- User-Friendly Interface: Designed for industry professionals while remaining accessible to newcomers.
Key Features
- Customizable Forecast Inputs: Adjust essential parameters such as revenue growth rates, EBITDA percentages, and capital expenditures.
- Instant DCF Valuation: Automatically computes intrinsic value, NPV, and other financial metrics with ease.
- High-Precision Accuracy: Leverages Ashtead Group plc's (AHTL) actual financial data for reliable valuation results.
- Streamlined Scenario Analysis: Effortlessly explore various assumptions and analyze different outcomes.
- Efficiency Booster: Save time by avoiding the creation of intricate valuation models from the ground up.
How It Works
- Step 1: Download the Excel file for Ashtead Group plc (AHTL).
- Step 2: Examine the pre-filled financial data and projections specific to Ashtead.
- Step 3: Adjust key inputs such as revenue growth, WACC, and tax rates (cells highlighted for your convenience).
- Step 4: Observe the DCF model update in real-time as you adjust your assumptions.
- Step 5: Review the outputs and utilize the findings to inform your investment strategies.
Why Choose This Calculator for Ashtead Group plc (AHTL)?
- User-Friendly and Accessible: Tailored for users of all experience levels.
- Customizable Inputs: Easily adjust parameters to suit your specific analysis needs.
- Real-Time Updates: Monitor immediate changes to Ashtead’s valuation as you tweak the inputs.
- Preconfigured Data: Comes loaded with Ashtead’s actual financial metrics for swift evaluations.
- Endorsed by Experts: Utilized by investors and analysts to drive informed investment choices.
Who Should Use This Product?
- Individual Investors: Make informed decisions regarding the purchase or sale of Ashtead Group plc (AHTL) shares.
- Financial Analysts: Enhance valuation processes with accessible financial models tailored for Ashtead Group plc (AHTL).
- Consultants: Provide quick and accurate valuation insights for clients regarding Ashtead Group plc (AHTL).
- Business Owners: Gain an understanding of how major companies like Ashtead Group plc (AHTL) are valued to inform your own business strategies.
- Finance Students: Learn valuation methodologies using real-world data and case studies focused on Ashtead Group plc (AHTL).
Overview of Template Components
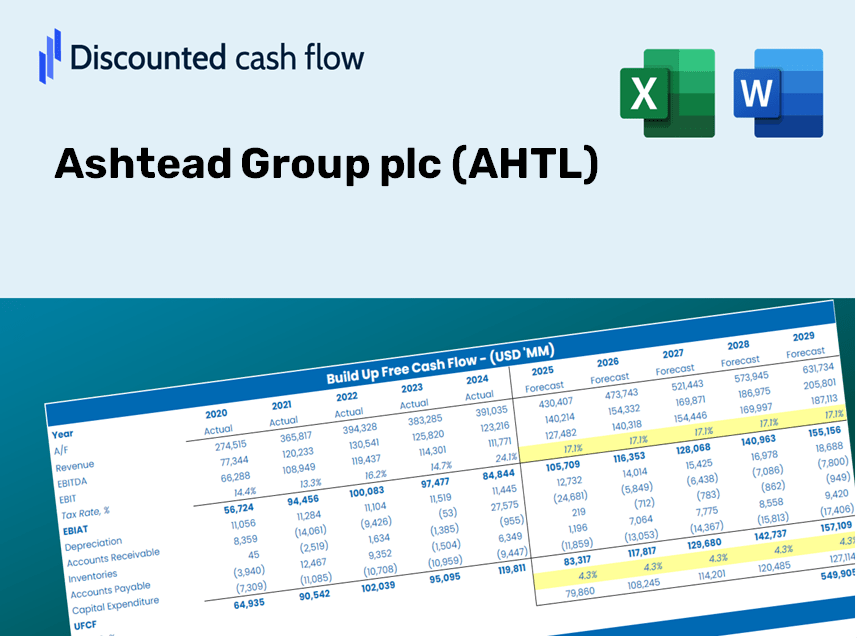
- Preloaded AHTL Data: Historical and forecasted financial information, encompassing revenue, EBIT, and capital expenditures.
- DCF and WACC Models: Advanced spreadsheets designed for calculating the intrinsic value and Weighted Average Cost of Capital.
- Customizable Inputs: Yellow-highlighted cells for modifying revenue growth rates, tax percentages, and discount rates.
- Financial Statements: Detailed annual and quarterly financials for thorough analysis.
- Key Ratios: Metrics on profitability, leverage, and efficiency to assess performance.
- Dashboard and Visuals: Graphical representations of valuation results and underlying assumptions.
Disclaimer
All information, articles, and product details provided on this website are for general informational and educational purposes only. We do not claim any ownership over, nor do we intend to infringe upon, any trademarks, copyrights, logos, brand names, or other intellectual property mentioned or depicted on this site. Such intellectual property remains the property of its respective owners, and any references here are made solely for identification or informational purposes, without implying any affiliation, endorsement, or partnership.
We make no representations or warranties, express or implied, regarding the accuracy, completeness, or suitability of any content or products presented. Nothing on this website should be construed as legal, tax, investment, financial, medical, or other professional advice. In addition, no part of this site—including articles or product references—constitutes a solicitation, recommendation, endorsement, advertisement, or offer to buy or sell any securities, franchises, or other financial instruments, particularly in jurisdictions where such activity would be unlawful.
All content is of a general nature and may not address the specific circumstances of any individual or entity. It is not a substitute for professional advice or services. Any actions you take based on the information provided here are strictly at your own risk. You accept full responsibility for any decisions or outcomes arising from your use of this website and agree to release us from any liability in connection with your use of, or reliance upon, the content or products found herein.