
|
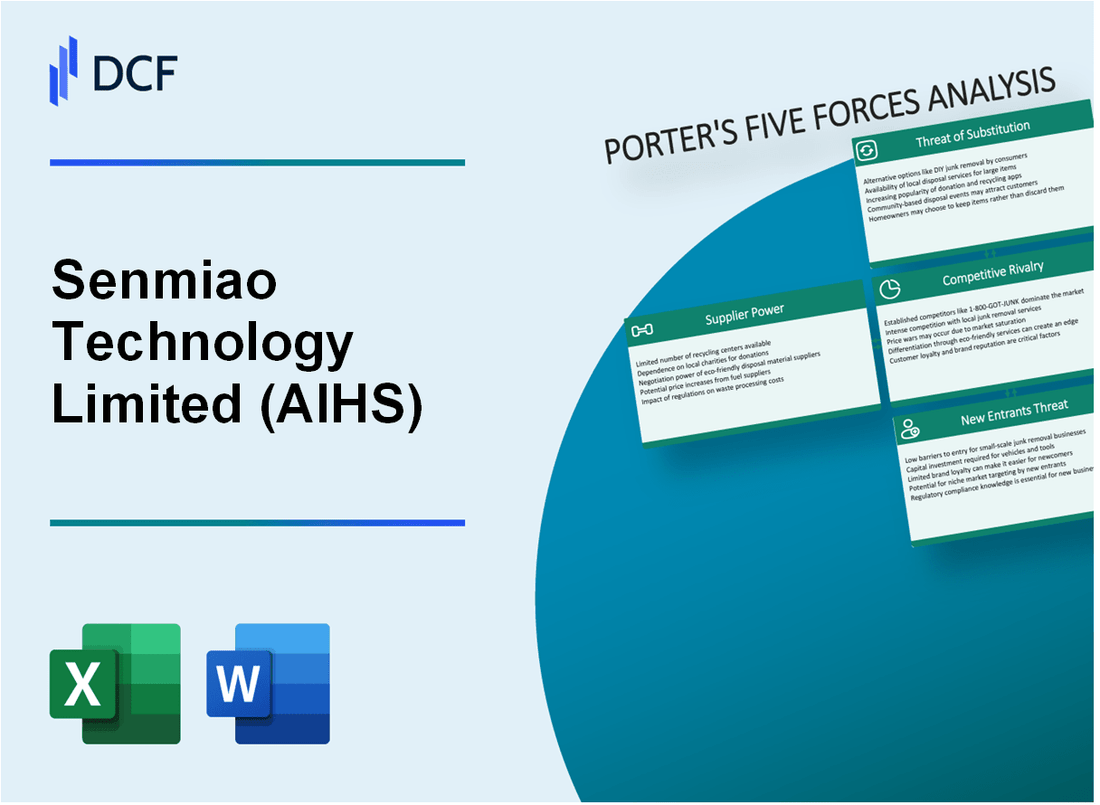
Senmiao Technology Limited (AIHS): 5 FORCES Analysis [Nov-2025 Updated] |
Fully Editable: Tailor To Your Needs In Excel Or Sheets
Professional Design: Trusted, Industry-Standard Templates
Investor-Approved Valuation Models
MAC/PC Compatible, Fully Unlocked
No Expertise Is Needed; Easy To Follow
Senmiao Technology Limited (AIHS) Bundle
You're looking at Senmiao Technology Limited (AIHS) right now, and honestly, the picture is tight: this micro-cap is fighting a tough pivot from ride-hailing to AI data systems while managing real financial pressure, evidenced by their $3.73 million net loss for FY 2025 and a recent $2.8 million capital raise in November 2025 to cover a $2.6 million working capital gap. With a market cap hovering around $5.15 million and revenue at just $3.39 million last fiscal year, understanding the external pressures is defintely key to seeing their path forward. Let's map out exactly how the five forces-from supplier leverage to customer power-are shaping the battlefield for Senmiao Technology Limited below.
Senmiao Technology Limited (AIHS) - Porter's Five Forces: Bargaining power of suppliers
When you look at Senmiao Technology Limited's position relative to its key suppliers-whether that's the financial institutions providing working capital or the manufacturers supplying vehicles-the power definitely tilts toward the seller's side. Honestly, this dynamic is amplified by the company's recent financial stress points.
The power held by financial institutions is high, which is a direct consequence of Senmiao Technology Limited's balance sheet health as of late 2025. As of September 30, 2025, the company reported a working capital deficit of roughly $2.6 million. This means current liabilities, what you owe soon, exceeded current assets, what you have on hand, by that amount. Furthermore, total liabilities at that date were $4.77 million against total assets of $4.68 million, resulting in a total equity deficit of $132,073. Management even noted substantial doubt about the ability to continue as a going concern.
This financial tightness means Senmiao Technology Limited has to rely on outside money, which hands lenders significant leverage. You saw this play out in November 2025 when the company completed a registered direct offering to raise approximately $2.8 million in gross proceeds. Relying on such financing, especially when facing a working capital deficit, signals to lenders that they hold the upper hand in negotiating terms.
Here's a quick look at the numbers that drive this lender power:
| Financial Metric | Amount as of September 30, 2025 | Source Context |
|---|---|---|
| Working Capital Deficit | $2.6 million | Indicates immediate liquidity pressure |
| Total Liabilities | $4.77 million | Exceeds total assets |
| Gross Proceeds from Nov 2025 Offering | $2.8 million | Demonstrates reliance on external capital |
| Total Equity Position | Deficit of $132,073 | Reflects a negative equity position |
Now, let's turn to the vehicle suppliers, particularly those providing New Energy Vehicles (NEVs). Suppliers of NEVs hold significant leverage because acquiring a full fleet involves a high capital cost. Senmiao Technology Limited, operating with tight working capital, cannot easily absorb large upfront purchases or dictate terms for high-value assets like vehicles.
To be fair, Senmiao Technology Limited's purchasing volume likely keeps it in a weaker negotiating position with major auto manufacturers. A company with a market capitalization of just $1.19 million as of the November 2025 offering announcement is a small customer in the grand scheme of global auto production. This limited volume means Senmiao Technology Limited has little leverage to demand lower prices or better payment terms from large-scale suppliers.
The supplier power dynamic is shaped by these factors:
- Financial institutions hold high power due to the $2.6 million working capital deficit.
- NEV suppliers command leverage due to high fleet acquisition capital costs.
- Senmiao Technology Limited is a small customer to major auto manufacturers.
- Reliance on capital raises, like the $2.8 million November 2025 offering, strengthens lender power.
Finance: draft 13-week cash view by Friday.
Senmiao Technology Limited (AIHS) - Porter's Five Forces: Bargaining power of customers
You're analyzing Senmiao Technology Limited (AIHS) and wondering how much sway its customers have over the business. Honestly, the bargaining power of customers in this space looks quite high, driven by low barriers to switching for both individual drivers and the larger platform partners.
For individual drivers or end-users seeking vehicle leasing and financing, the switching costs appear low. If a driver finds Senmiao Technology Limited's terms unfavorable, the market offers alternatives that let them bypass the heavy upfront cost of buying or financing a car. For instance, we see major ride-hailing platforms globally piloting models where drivers simply rent a vehicle and use a partner's charging network, removing the need for the driver to secure financing themselves, which directly competes with Senmiao Technology Limited's core offering. This ease of moving to a rental-only model puts pressure on pricing and contract terms.
The larger customers, the ride-hailing service providers or Partner Platforms, also hold significant leverage. These platforms operate in a fiercely competitive environment in China, which naturally leads to pricing pressures. A Partner Platform can easily switch to another data management or leasing vendor because the ecosystem is built on partnerships. We've seen major players like DiDi form joint ventures with automakers (like Volkswagen and BYD) and battery suppliers (like CATL) to secure fleets. Plus, the existence of a 'Platform of Platforms' structure, where operating platforms can join or leave aggregators like AutoNavi, shows that vendor lock-in for essential services isn't absolute.
The financial scale of Senmiao Technology Limited itself reinforces this dynamic. The small revenue base of $3.39 million in FY 2025 suggests no single customer or platform accounts for a dominant share of the company's income, but market alternatives are abundant. When you're a small supplier, your largest customers have more leverage over you than you have over them. The market capitalization as of November 14, 2025, was only $1.45 million, which means any major customer walking away would cause a significant revenue hole.
Customers definitely have other places to spend their money, which is a major power lever. Beyond alternative leasing models, individual customers can choose direct bank financing or manufacturer leasing programs instead of going through a third-party service provider like Senmiao Technology Limited. Automakers in China, concerned about ride-hailing eating into new car sales, have proactively launched their own leasing projects, with General Motors Co's Cadillac being one example. This direct competition from OEMs (Original Equipment Manufacturers) provides a high-quality, often subsidized, alternative for customers.
Here's a quick look at the financial context that frames this customer power:
| Metric | Value (FY 2025 or Latest Available) | Significance to Customer Power |
|---|---|---|
| Total Revenue (FYE March 31, 2025) | $3.39 million | Small revenue base suggests no customer dominance, increasing leverage for any large client. |
| Net Loss (FYE March 31, 2025) | -$3.73 million | Unprofitability means the company needs revenue urgently, making it less able to resist customer demands. |
| Revenue (Six Months Ended Sept 30, 2025) | $1.80 million | Indicates a low volume of business, meaning customers can easily find alternative suppliers. |
| Market Capitalization (Nov 14, 2025) | $1.45 million | Micro-cap status amplifies the impact of customer attrition. |
The pressure is on Senmiao Technology Limited to offer competitive terms, because the alternatives for both drivers and platforms are readily available and often backed by larger entities.
Senmiao Technology Limited (AIHS) - Porter's Five Forces: Competitive rivalry
You're looking at Senmiao Technology Limited (AIHS) and seeing a company fighting for survival in a hyper-competitive space. The rivalry force here is absolutely brutal, stemming from both the legacy auto-finance/ride-hailing business and the new B2B technology focus.
The core China ride-hailing and auto-finance sector is dominated by entrenched giants. Didi Chuxing remains the behemoth, having driven Uber out of China back in 2016. While Didi's market share has slipped from its peak of around 90 per cent to about 70 per cent in a recent period, it still facilitates massive volume; for instance, it handles about 24 million daily rides in Shanghai alone. Competitors like Meituan Dianping and Alibaba-backed Gaode are chipping away, with Meituan managing roughly half a million daily rides and Gaode around 700,000 daily rides in that same city. This environment forces aggressive pricing, which directly impacts Senmiao Technology Limited's ability to turn a profit.
The financial evidence of this severe rivalry is stark. For the fiscal year ending March 31, 2025, Senmiao Technology Limited reported a net loss of -$3.73 million on total revenue of $3.39 million. Honestly, that translates to a Net Profit Margin of -102.30% for FY 2025, showing that price competition and operational costs are crushing profitability.
To gauge the scale of the fight, consider the company's market valuation. As of November 18, 2025, Senmiao Technology Limited's market capitalization stood at just $1.16 million, with another data point showing it at $1.71 million around the same time. This tiny market cap, compared to the scale of the giants, means the company is fighting for scraps with minimal financial firepower.
Here's a quick look at the competitive landscape metrics we have:
| Metric | Senmiao Technology Limited (AIHS) | Didi (Historical Benchmark) |
| FY 2025 Net Loss | -$3.73 million | Continuous operating loss reported historically |
| Market Cap (Late 2025) | Approx. $1.16 million to $1.71 million | Valued at US$68 billion at its 2021 IPO |
| Daily Rides (Shanghai Example) | Not specified post-pivot | Approx. 24 million |
The company's strategic pivot introduces a new layer of rivalry. Following the sale of its ride-hailing platform, Senmiao Technology is now focusing on monetizing its historical data assets. In June 2025, it signed a strategic partnership with Changsha Yipeng Information Technology to develop an AI-backed data management system. Changsha Yipeng brings over a decade of experience in AI-based information systems, big data, and cloud platforms, positioning Senmiao against established B2B technology providers in the mobility sector.
This pivot is an attempt to shift from direct operational competition to a technology enablement role, but it still faces established players. The company is also pursuing partnerships, such as the one with Qinhong International Group, to leverage shared networks and access new financing channels, which is a defensive move against capital constraints.
Key competitive dynamics in the old and new arenas include:
- Intense price wars in ride-hailing, historically forcing rivals like Didi to match spending.
- Traditional carmakers, including SAIC Motor and Geely, launching their own ride-hailing services.
- Senmiao Technology Limited's FY 2025 Net Loss of -$3.73 million.
- The company's market capitalization is extremely small, around $1.16 million as of November 2025.
- The new AI data system relies on a partner with over a decade of experience in AI and cloud platforms.
Senmiao Technology Limited (AIHS) - Porter's Five Forces: Threat of substitutes
You're looking at the landscape around Senmiao Technology Limited (AIHS) and wondering what other options customers have besides their core vehicle financing and leasing business. That's smart; substitutes can erode market share fast, even if they aren't in the exact same business.
Public transportation, personal car ownership, and traditional taxi services remain strong substitutes for the ride-hailing segment, even though Senmiao Technology Limited discontinued its online ride-hailing platform services in August 2024. To give you a sense of the scale of public transit alternatives, China boasts the world's most extensive high-speed rail network, with over 42,000 kilometers of track serviced by automated or semi-automated trains. Furthermore, in cities testing automated taxis, the average cost per trip on automated public transport is just RMB 2 (USD 0.3), making it a far more affordable option than private transport options. As of H1 2025, New Energy Vehicle (NEV) penetration of China's passenger vehicle market surged to 50.1%, meaning half of all new cars sold are electric or plug-in hybrid, which directly impacts the need for ride-hailing or leasing services for personal mobility.
Direct vehicle purchase or leasing from large auto dealerships or banks substitutes Senmiao Technology Limited's financing/leasing services. You have to look at the sheer volume of vehicle transactions happening. For instance, in the first half of 2025, total passenger vehicle sales in China reached 10,891,000 units, with NEV sales growing 33% to 5,458,000 units. Senmiao Technology Limited's own report as of March 31, 2025, showed they facilitated financing for 312 automobiles and sold 1,516 automobiles, which is a small fraction of the overall market activity. The competition from traditional financing channels is immense.
Here's a quick look at the vehicle market dynamics that show the scale of substitution:
| Vehicle Type/Metric | Value/Percentage | Period/Date |
|---|---|---|
| Total Passenger Vehicle Sales | 10,891,000 units | H1 2025 |
| NEV Sales | 5,458,000 units | H1 2025 |
| Traditional ICE Vehicle Sales | 5,433,000 units | H1 2025 |
| NEV Penetration Rate | 50.1% | H1 2025 |
| Senmiao Auto Sales Facilitated | 1,516 units | As of March 31, 2025 |
Using general-purpose AI platforms or in-house IT development substitutes Senmiao Technology Limited's specialized AI-backed data systems. The adoption of AI in China is massive, which means any in-house IT department or competitor can likely source a powerful, general-purpose tool rather than relying on a specialized vendor. By mid-2025, China's generative AI user base doubled to 515 million. What's key here is preference: over 90% of respondents indicated their first choice was a domestic AI model. This suggests that if Senmiao Technology Limited's proprietary systems aren't demonstrably superior to the rapidly improving general models available to competitors, the substitution risk is high.
Low cost of non-NEV vehicles or used cars provides a substitute for NEV leasing. While the market is pushing NEVs, the lower upfront cost of a traditional Internal Combustion Engine (ICE) vehicle or a used car is a persistent substitute for leasing a New Energy Vehicle (NEV). In H1 2025, sales of traditional ICE vehicles were down 5.2% year-over-year, but they still accounted for 5,433,000 units in that period. Furthermore, the used car market offers a cheaper entry point than leasing a new NEV, which is a major consideration given Senmiao Technology Limited's Total Revenues were only $3.39 million in its latest reported period.
The threat is amplified by the general market conditions for Senmiao Technology Limited, which reported a Loss from Operations of $(3.87) million and a working capital deficit, meaning any shift in customer preference toward these substitutes directly impacts their ability to sustain operations.
Senmiao Technology Limited (AIHS) - Porter's Five Forces: Threat of new entrants
You're looking at the barriers for a new player trying to muscle in on Senmiao Technology Limited's turf, which is mostly auto transaction and financing services in China's ride-hailing ecosystem. Honestly, the hurdles are quite high, especially if they try to replicate the old model.
The sheer scale of the New Energy Vehicle (NEV) market in China demands massive upfront capital for fleet financing. As of June 2025, the total NEV ownership hit 36.89 million units. To finance even a fraction of that, or to compete with established leasing operations like Senmiao Technology Limited's, which facilitated financing for 312 automobiles and managed 2,116 operating leases as of March 31, 2025, requires deep pockets. Regulatory compliance in the ride-hailing sector adds another layer of complexity and cost that a startup must absorb right away.
Building a customer base against the incumbents is tough because of network effects. Senmiao Technology Limited itself recognized this difficulty in the platform space, divesting its online ride-hailing platform services in August 2024. New entrants trying to build a driver/rider network from scratch face a steep climb against platforms that already have millions of transactions under their belt. Plus, the auto manufacturing side is dominated by giants; for example, BYD commands over one-third of new EV sales in China.
The strategic pivot toward B2B data services, like the agreement Senmiao Technology Limited signed with Changsha Yipeng Information Technology Co. in June 2025 to develop an AI-backed data management system, changes the calculus. This shift lowers the barrier related to physical asset financing but raises the bar for technical talent. You need specialized AI expertise, not just auto finance know-how, to make that segment work. This is a different kind of capital requirement-human capital and R&D investment.
Still, the SME and individual auto-finance market remains somewhat fragmented, which is where smaller, nimbler financing firms can find an opening with lower overhead than a full-scale leasing operation. Senmiao Technology Limited's own market capitalization as of November 20, 2025, was only $1.39 million, which shows that very small entities can operate in the periphery of this market. However, the financial struggles of even a listed company like Senmiao Technology Limited-reporting an annual net loss of $3.7 million for fiscal year 2025-suggests that low overhead doesn't automatically translate to profitability.
Here's a quick look at how the capital intensity and market scale contrast for a new entrant:
| Metric | Data Point (Latest Available 2025) | Relevance to New Entrants |
|---|---|---|
| China Total NEV Ownership | 36.89 million units (June 2025) | Indicates massive financing scale required to compete. |
| Senmiao Technology FY 2025 Revenue | $3.39 million | Shows the revenue scale of an existing, struggling player. |
| Senmiao Q4 2025 Projected Net Loss | $-1.91 million | Highlights the high operating risk even for established players. |
| Senmiao Nov 2025 Gross Proceeds from Offering | Approximately $2.8 million | Shows the capital injection needed to sustain operations. |
| China Auto Industry Sales Profit Margin | 4.4% (First 11 months of 2024) | Suggests thin margins across the value chain, pressuring new entrants. |
If you are considering entering the financing side, remember that even with lower overhead, the market is unforgiving on margins. Finance: draft 13-week cash view by Friday.
Disclaimer
All information, articles, and product details provided on this website are for general informational and educational purposes only. We do not claim any ownership over, nor do we intend to infringe upon, any trademarks, copyrights, logos, brand names, or other intellectual property mentioned or depicted on this site. Such intellectual property remains the property of its respective owners, and any references here are made solely for identification or informational purposes, without implying any affiliation, endorsement, or partnership.
We make no representations or warranties, express or implied, regarding the accuracy, completeness, or suitability of any content or products presented. Nothing on this website should be construed as legal, tax, investment, financial, medical, or other professional advice. In addition, no part of this site—including articles or product references—constitutes a solicitation, recommendation, endorsement, advertisement, or offer to buy or sell any securities, franchises, or other financial instruments, particularly in jurisdictions where such activity would be unlawful.
All content is of a general nature and may not address the specific circumstances of any individual or entity. It is not a substitute for professional advice or services. Any actions you take based on the information provided here are strictly at your own risk. You accept full responsibility for any decisions or outcomes arising from your use of this website and agree to release us from any liability in connection with your use of, or reliance upon, the content or products found herein.