
|
Alpha Group International plc (ALPH.L) DCF Valuation |
Fully Editable: Tailor To Your Needs In Excel Or Sheets
Professional Design: Trusted, Industry-Standard Templates
Investor-Approved Valuation Models
MAC/PC Compatible, Fully Unlocked
No Expertise Is Needed; Easy To Follow
Alpha Group International plc (ALPH.L) Bundle
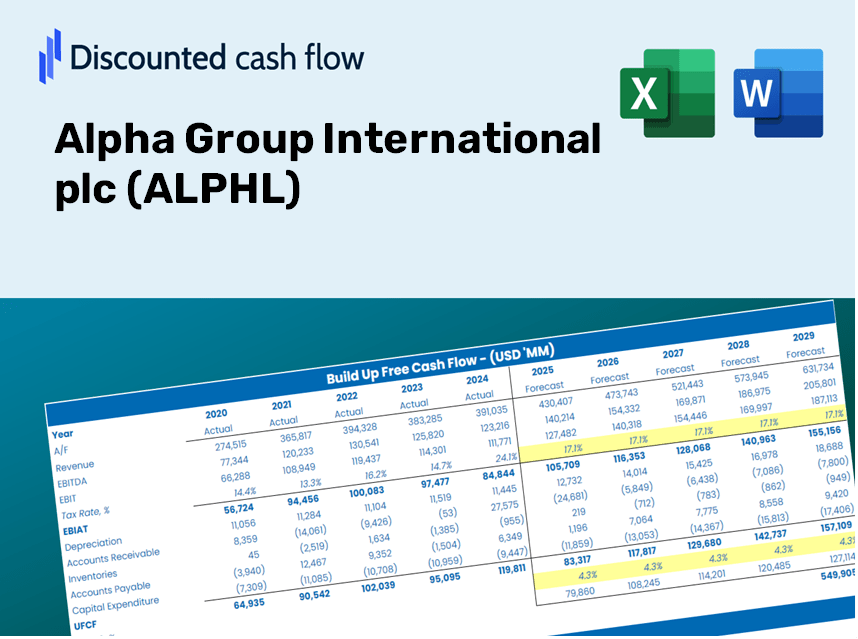
Whether you’re an investor or analyst, this ALPHL DCF Calculator is your go-to resource for accurate valuation. Loaded with real data from Alpha Group International plc, you can adjust forecasts and view the effects in real time.
Discounted Cash Flow (DCF) - (USD MM)
| Year | AY1 2020 |
AY2 2021 |
AY3 2022 |
AY4 2023 |
AY5 2024 |
FY1 2025 |
FY2 2026 |
FY3 2027 |
FY4 2028 |
FY5 2029 |
|---|---|---|---|---|---|---|---|---|---|---|
| Revenue | 46.2 | 77.5 | 107.6 | 186.0 | 135.6 | 187.2 | 258.5 | 356.9 | 492.7 | 680.2 |
| Revenue Growth, % | 0 | 67.62 | 38.9 | 72.81 | -27.08 | 38.06 | 38.06 | 38.06 | 38.06 | 38.06 |
| EBITDA | 19.2 | 36.2 | 49.8 | 118.9 | 135.5 | 111.7 | 154.3 | 213.0 | 294.1 | 406.0 |
| EBITDA, % | 41.59 | 46.74 | 46.24 | 63.96 | 99.92 | 59.69 | 59.69 | 59.69 | 59.69 | 59.69 |
| Depreciation | 1.8 | 2.3 | 3.5 | 6.4 | 11.2 | 8.1 | 11.2 | 15.5 | 21.4 | 29.6 |
| Depreciation, % | 3.79 | 3.03 | 3.24 | 3.44 | 8.24 | 4.35 | 4.35 | 4.35 | 4.35 | 4.35 |
| EBIT | 17.5 | 33.9 | 46.3 | 112.5 | 124.3 | 103.6 | 143.0 | 197.5 | 272.7 | 376.5 |
| EBIT, % | 37.8 | 43.71 | 43 | 60.52 | 91.68 | 55.34 | 55.34 | 55.34 | 55.34 | 55.34 |
| Total Cash | 98.8 | 113.8 | 136.8 | 197.9 | 252.5 | 187.2 | 258.5 | 356.9 | 492.7 | 680.2 |
| Total Cash, percent | .0 | .0 | .0 | .0 | .0 | .0 | .0 | .0 | .0 | .0 |
| Account Receivables | 57.3 | 66.4 | 4.4 | 4.5 | 9.0 | 74.4 | 102.8 | 141.9 | 195.9 | 270.5 |
| Account Receivables, % | 124.04 | 85.68 | 4.07 | 2.44 | 6.61 | 39.76 | 39.76 | 39.76 | 39.76 | 39.76 |
| Inventories | .0 | -84.2 | 94.7 | .0 | .0 | -4.5 | -6.2 | -8.5 | -11.8 | -16.3 |
| Inventories, % | 0 | -108.73 | 88.04 | 0 | 0 | -2.39 | -2.39 | -2.39 | -2.39 | -2.39 |
| Accounts Payable | 17.6 | 36.7 | .0 | .0 | .0 | 32.0 | 44.2 | 61.0 | 84.2 | 116.2 |
| Accounts Payable, % | 38.06 | 47.37 | 0 | 0 | 0 | 17.09 | 17.09 | 17.09 | 17.09 | 17.09 |
| Capital Expenditure | -2.1 | -2.7 | -5.2 | -15.2 | -8.8 | -10.3 | -14.2 | -19.6 | -27.1 | -37.4 |
| Capital Expenditure, % | -4.52 | -3.42 | -4.85 | -8.17 | -6.49 | -5.49 | -5.49 | -5.49 | -5.49 | -5.49 |
| Tax Rate, % | 24.44 | 24.44 | 24.44 | 24.44 | 24.44 | 24.44 | 24.44 | 24.44 | 24.44 | 24.44 |
| EBITAT | 12.7 | 24.0 | 38.2 | 86.2 | 93.9 | 78.4 | 108.3 | 149.5 | 206.4 | 284.9 |
| Depreciation | ||||||||||
| Changes in Account Receivables | ||||||||||
| Changes in Inventories | ||||||||||
| Changes in Accounts Payable | ||||||||||
| Capital Expenditure | ||||||||||
| UFCF | -27.4 | 118.0 | -117.2 | 172.0 | 91.9 | 47.3 | 90.8 | 125.4 | 173.2 | 239.1 |
| WACC, % | 9.19 | 9.19 | 9.2 | 9.2 | 9.2 | 9.2 | 9.2 | 9.2 | 9.2 | 9.2 |
| PV UFCF | ||||||||||
| SUM PV UFCF | 491.6 | |||||||||
| Long Term Growth Rate, % | 2.00 | |||||||||
| Free cash flow (T + 1) | 244 | |||||||||
| Terminal Value | 3,389 | |||||||||
| Present Terminal Value | 2,183 | |||||||||
| Enterprise Value | 2,674 | |||||||||
| Net Debt | -230 | |||||||||
| Equity Value | 2,904 | |||||||||
| Diluted Shares Outstanding, MM | 44 | |||||||||
| Equity Value Per Share | 6,610.07 |
What You Will Receive
- Customizable Excel Template: A fully adaptable Excel-based DCF Calculator featuring pre-filled financial data for Alpha Group International plc (ALPHL).
- Actual Data Insights: Access to historical figures and forward-looking projections (highlighted in the yellow cells).
- Flexible Forecasting: Modify assumptions such as revenue growth, EBITDA percentage, and WACC with ease.
- Instant Calculations: Analyze how your inputs affect the valuation of Alpha Group International plc (ALPHL) in real time.
- Professional Resource: Designed for investors, CFOs, consultants, and financial analysts.
- Intuitive Design: Organized for clarity and ease of use, complete with step-by-step guidance.
Key Features
- Real-Time ALPHL Data: Pre-loaded with Alpha Group International's historical financial performance and future projections.
- Customizable Parameters: Modify revenue growth rates, profit margins, WACC, taxation, and capital expenditures to suit your analysis.
- Adaptive Valuation Framework: Automatically recalibrates Net Present Value (NPV) and intrinsic value based on your specified inputs.
- Scenario Analysis: Develop various forecasting scenarios to explore a range of valuation possibilities.
- Intuitive Design: A straightforward layout that caters to both experienced professionals and newcomers.
How It Works
- Step 1: Download the Excel spreadsheet.
- Step 2: Examine the pre-filled data for Alpha Group International plc (ALPHL) (historical and projected).
- Step 3: Modify key assumptions (highlighted in yellow) based on your analysis.
- Step 4: Observe automatic recalculations for Alpha Group International plc’s intrinsic value.
- Step 5: Leverage the results for investment decisions or reporting purposes.
Why Choose This Calculator?
- User-Friendly Interface: Perfect for both novices and seasoned professionals.
- Customizable Inputs: Adjust parameters easily to suit your analysis needs.
- Real-Time Updates: Observe immediate changes to Alpha Group International’s valuation as you modify inputs.
- Preloaded Data: Comes with Alpha Group International's actual financial figures for swift evaluation.
- Relied Upon by Experts: Preferred by investors and analysts for making well-informed choices.
Who Can Benefit from This Product?
- Professional Investors: Develop comprehensive and trustworthy valuation models for portfolio evaluation.
- Corporate Finance Teams: Assess valuation scenarios to inform internal strategic decisions.
- Consultants and Advisors: Deliver precise valuation insights for Alpha Group International plc (ALPHL) to clients.
- Students and Educators: Utilize real-world data for practicing and teaching financial modeling techniques.
- Tech Enthusiasts: Gain insights into how tech companies like Alpha Group International plc (ALPHL) are appraised in the market.
What the Template Includes
- Preloaded ALPHL Data: Historical and forecasted financial metrics, encompassing revenue, EBIT, and capital expenditures.
- DCF and WACC Models: Advanced spreadsheets for determining intrinsic value and Weighted Average Cost of Capital.
- Editable Inputs: Cells highlighted in yellow for modifying revenue growth, tax rates, and discount rates.
- Financial Statements: Detailed annual and quarterly financial reports for in-depth analysis.
- Key Ratios: Metrics for profitability, leverage, and efficiency to assess performance.
- Dashboard and Charts: Graphical representations of valuation results and underlying assumptions.
Disclaimer
All information, articles, and product details provided on this website are for general informational and educational purposes only. We do not claim any ownership over, nor do we intend to infringe upon, any trademarks, copyrights, logos, brand names, or other intellectual property mentioned or depicted on this site. Such intellectual property remains the property of its respective owners, and any references here are made solely for identification or informational purposes, without implying any affiliation, endorsement, or partnership.
We make no representations or warranties, express or implied, regarding the accuracy, completeness, or suitability of any content or products presented. Nothing on this website should be construed as legal, tax, investment, financial, medical, or other professional advice. In addition, no part of this site—including articles or product references—constitutes a solicitation, recommendation, endorsement, advertisement, or offer to buy or sell any securities, franchises, or other financial instruments, particularly in jurisdictions where such activity would be unlawful.
All content is of a general nature and may not address the specific circumstances of any individual or entity. It is not a substitute for professional advice or services. Any actions you take based on the information provided here are strictly at your own risk. You accept full responsibility for any decisions or outcomes arising from your use of this website and agree to release us from any liability in connection with your use of, or reliance upon, the content or products found herein.