
|
Alpha Metallurgical Resources, Inc. (AMR) DCF Valuation |
Fully Editable: Tailor To Your Needs In Excel Or Sheets
Professional Design: Trusted, Industry-Standard Templates
Investor-Approved Valuation Models
MAC/PC Compatible, Fully Unlocked
No Expertise Is Needed; Easy To Follow
Alpha Metallurgical Resources, Inc. (AMR) Bundle
Whether you’re an investor or analyst, this (AMR) DCF Calculator is your ultimate tool for accurate valuation. Preloaded with Alpha Metallurgical Resources, Inc. real data, you can adjust forecasts and instantly observe the effects.
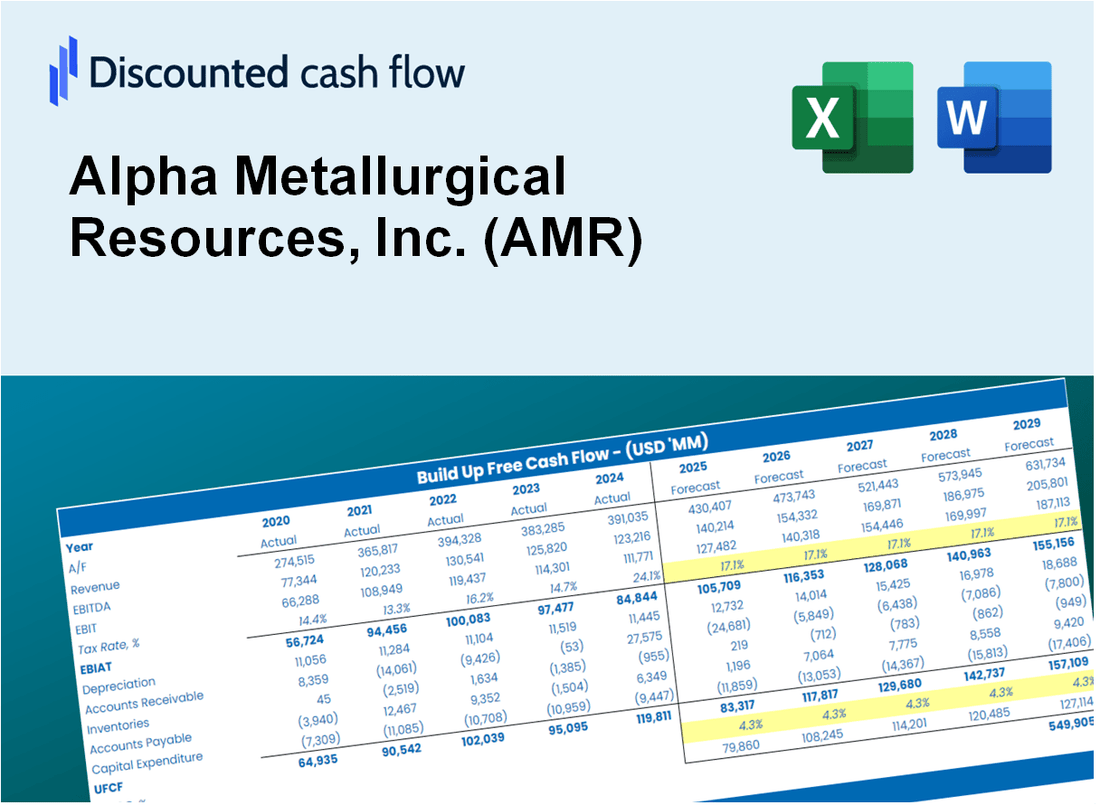
Discounted Cash Flow (DCF) - (USD MM)
| Year | AY1 2020 |
AY2 2021 |
AY3 2022 |
AY4 2023 |
AY5 2024 |
FY1 2025 |
FY2 2026 |
FY3 2027 |
FY4 2028 |
FY5 2029 |
|---|---|---|---|---|---|---|---|---|---|---|
| Revenue | 1,416.2 | 2,258.7 | 4,101.6 | 3,471.4 | 2,957.3 | 3,777.3 | 4,824.6 | 6,162.3 | 7,870.9 | 10,053.3 |
| Revenue Growth, % | 0 | 59.49 | 81.59 | -15.36 | -14.81 | 27.73 | 27.73 | 27.73 | 27.73 | 27.73 |
| EBITDA | -7.6 | 485.1 | 1,703.7 | 1,023.3 | 388.6 | 794.0 | 1,014.1 | 1,295.3 | 1,654.4 | 2,113.2 |
| EBITDA, % | -0.53496 | 21.48 | 41.54 | 29.48 | 13.14 | 21.02 | 21.02 | 21.02 | 21.02 | 21.02 |
| Depreciation | 161.5 | 123.3 | 127.1 | 170.9 | 174.0 | 232.5 | 296.9 | 379.2 | 484.4 | 618.7 |
| Depreciation, % | 11.41 | 5.46 | 3.1 | 4.92 | 5.88 | 6.15 | 6.15 | 6.15 | 6.15 | 6.15 |
| EBIT | -169.1 | 361.9 | 1,576.6 | 852.4 | 214.6 | 561.5 | 717.2 | 916.0 | 1,170.0 | 1,494.5 |
| EBIT, % | -11.94 | 16.02 | 38.44 | 24.55 | 7.26 | 14.87 | 14.87 | 14.87 | 14.87 | 14.87 |
| Total Cash | 139.2 | 81.2 | 348.0 | 268.2 | 481.6 | 346.9 | 443.1 | 566.0 | 722.9 | 923.3 |
| Total Cash, percent | .0 | .0 | .0 | .0 | .0 | .0 | .0 | .0 | .0 | .0 |
| Account Receivables | 223.5 | 489.2 | 407.2 | 509.7 | 362.1 | 561.3 | 716.9 | 915.7 | 1,169.6 | 1,493.9 |
| Account Receivables, % | 15.78 | 21.66 | 9.93 | 14.68 | 12.25 | 14.86 | 14.86 | 14.86 | 14.86 | 14.86 |
| Inventories | 108.1 | 129.4 | 200.6 | 231.3 | 169.3 | 231.4 | 295.6 | 377.6 | 482.3 | 616.0 |
| Inventories, % | 7.63 | 5.73 | 4.89 | 6.66 | 5.72 | 6.13 | 6.13 | 6.13 | 6.13 | 6.13 |
| Accounts Payable | 58.4 | 90.1 | 106.0 | 128.8 | 96.6 | 133.5 | 170.6 | 217.9 | 278.3 | 355.4 |
| Accounts Payable, % | 4.12 | 3.99 | 2.59 | 3.71 | 3.27 | 3.54 | 3.54 | 3.54 | 3.54 | 3.54 |
| Capital Expenditure | -154.0 | -83.3 | -164.3 | -245.4 | -198.8 | -244.5 | -312.2 | -398.8 | -509.4 | -650.6 |
| Capital Expenditure, % | -10.87 | -3.69 | -4.01 | -7.07 | -6.72 | -6.47 | -6.47 | -6.47 | -6.47 | -6.47 |
| Tax Rate, % | 10.99 | 10.99 | 10.99 | 10.99 | 10.99 | 10.99 | 10.99 | 10.99 | 10.99 | 10.99 |
| EBITAT | -310.2 | 357.6 | 1,468.9 | 727.9 | 191.0 | 523.8 | 669.0 | 854.5 | 1,091.4 | 1,394.0 |
| Depreciation | ||||||||||
| Changes in Account Receivables | ||||||||||
| Changes in Inventories | ||||||||||
| Changes in Accounts Payable | ||||||||||
| Capital Expenditure | ||||||||||
| UFCF | -575.8 | 142.2 | 1,458.4 | 542.9 | 343.6 | 287.4 | 470.9 | 601.5 | 768.2 | 981.2 |
| WACC, % | 8.24 | 8.24 | 8.23 | 8.21 | 8.22 | 8.23 | 8.23 | 8.23 | 8.23 | 8.23 |
| PV UFCF | ||||||||||
| SUM PV UFCF | 2,362.9 | |||||||||
| Long Term Growth Rate, % | 0.50 | |||||||||
| Free cash flow (T + 1) | 986 | |||||||||
| Terminal Value | 12,763 | |||||||||
| Present Terminal Value | 8,596 | |||||||||
| Enterprise Value | 10,959 | |||||||||
| Net Debt | -476 | |||||||||
| Equity Value | 11,435 | |||||||||
| Diluted Shares Outstanding, MM | 13 | |||||||||
| Equity Value Per Share | 875.81 |
What You Will Get
- Comprehensive AMR Financials: Access historical and projected data for precise valuation.
- Customizable Parameters: Adjust WACC, tax rates, revenue growth, and capital expenditures.
- Dynamic Calculations: Intrinsic value and NPV are computed in real-time.
- Scenario Analysis: Evaluate various scenarios to assess Alpha Metallurgical Resources' future performance.
- User-Friendly Design: Crafted for industry professionals while remaining approachable for newcomers.
Key Features
- Comprehensive Financial Data: Gain access to precise historical figures and future forecasts for Alpha Metallurgical Resources, Inc. (AMR).
- Adjustable Forecast Parameters: Modify highlighted cells for metrics such as WACC, growth rates, and profit margins.
- Real-Time Calculations: Instant updates for DCF, Net Present Value (NPV), and cash flow assessments.
- User-Friendly Dashboard: Clear charts and summaries to help you visualize your valuation outcomes.
- Suitable for All Experience Levels: An easy-to-navigate design tailored for investors, CFOs, and consultants alike.
How It Works
- Step 1: Download the Excel file for Alpha Metallurgical Resources, Inc. (AMR).
- Step 2: Review the pre-filled financial data and forecasts for (AMR).
- Step 3: Adjust key inputs such as revenue growth, WACC, and tax rates (highlighted cells).
- Step 4: Observe the DCF model update in real-time as you modify your assumptions.
- Step 5: Evaluate the outputs and leverage the results for your investment strategies.
Why Choose This Calculator for Alpha Metallurgical Resources, Inc. (AMR)?
- User-Friendly Interface: Tailored for both novices and seasoned professionals.
- Customizable Inputs: Adjust parameters easily to suit your financial analysis.
- Real-Time Valuation: Observe immediate updates to AMR’s valuation as you tweak inputs.
- Pre-Loaded Data: Comes with AMR’s actual financial metrics for swift evaluations.
- Endorsed by Experts: Utilized by analysts and investors for data-driven decisions.
Who Should Use This Product?
- Investors: Evaluate Alpha Metallurgical Resources, Inc. (AMR)'s market position before making investment decisions.
- CFOs and Financial Analysts: Optimize valuation assessments and validate financial forecasts for AMR.
- Startup Founders: Understand the valuation methodologies of established companies like Alpha Metallurgical Resources, Inc. (AMR).
- Consultants: Create comprehensive valuation reports tailored for clients in the mining sector.
- Students and Educators: Utilize industry-specific data to enhance learning and application of valuation strategies.
What the Template Contains
- Preloaded AMR Data: Historical and projected financial data, including revenue, EBIT, and capital expenditures.
- DCF and WACC Models: Professional-grade sheets for calculating intrinsic value and Weighted Average Cost of Capital.
- Editable Inputs: Yellow-highlighted cells for adjusting revenue growth, tax rates, and discount rates.
- Financial Statements: Comprehensive annual and quarterly financials for deeper analysis.
- Key Ratios: Profitability, leverage, and efficiency ratios to evaluate performance.
- Dashboard and Charts: Visual summaries of valuation outcomes and assumptions.
Disclaimer
All information, articles, and product details provided on this website are for general informational and educational purposes only. We do not claim any ownership over, nor do we intend to infringe upon, any trademarks, copyrights, logos, brand names, or other intellectual property mentioned or depicted on this site. Such intellectual property remains the property of its respective owners, and any references here are made solely for identification or informational purposes, without implying any affiliation, endorsement, or partnership.
We make no representations or warranties, express or implied, regarding the accuracy, completeness, or suitability of any content or products presented. Nothing on this website should be construed as legal, tax, investment, financial, medical, or other professional advice. In addition, no part of this site—including articles or product references—constitutes a solicitation, recommendation, endorsement, advertisement, or offer to buy or sell any securities, franchises, or other financial instruments, particularly in jurisdictions where such activity would be unlawful.
All content is of a general nature and may not address the specific circumstances of any individual or entity. It is not a substitute for professional advice or services. Any actions you take based on the information provided here are strictly at your own risk. You accept full responsibility for any decisions or outcomes arising from your use of this website and agree to release us from any liability in connection with your use of, or reliance upon, the content or products found herein.